Experiment 7: Determination of the Isoelectric Point of Casein
Table of Contents
Introduction
| Table of Contents | next section >> |
The protein casein has been isolated from skim milk powder. Upon isolation, the isoelectric point of casein will be determined, followed by exploring the effects of acids and bases on both buffered and non-buffered solutions of casein. Proteins are large, polymeric, biological molecules composed of many (hundreds, sometimes > 1000) amino acids units, linked through peptide bonds.
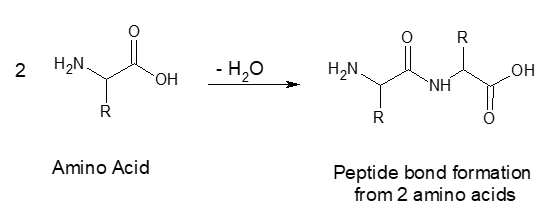
Figure 1 – Peptide bond formation reaction
Amino acids vary by the substituent R (there are 20 naturally occurring variants, including 2 acidic and 3 basic variants). Proteins have varying amino acid compositions, which, depending on quantity and relative placement of R groups in the protein structure, will impart unique structure and biological functionality.
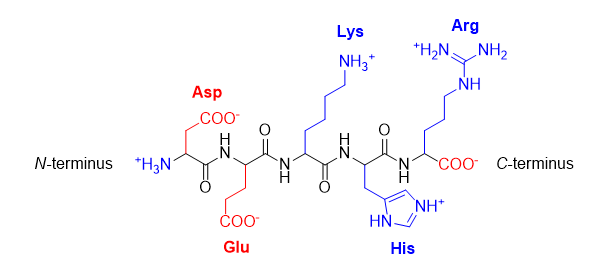
Figure 2 – The acidic amino acids aspartic acid (Asp) and glutamic acid (Glu), and the basic amino acids lysine (Lys), histidine (His), and arginine (Arg), all shown in their charged forms.
A protein’s overall charge is determined by the number of acidic and basic side chains (R groups). The protein backbone (everything but the R group) contains one basic amino group at the amino terminus (N‑terminus), and an acidic carboxylate group at the carboxy terminus (C‑terminus). At very low pH, all the R groups are protonated; Asp and Glu are neutral, while Lys, His and Arg are positively charged, so the protein has an overall positive charge. At very high pH, Asp and Glu are negatively charged, while Lys, His and Arg are neutral, so the protein has an overall negative charge. At some point between these extremes, the protein will have an equal number of positive and negative charges, for an overall charge of zero. This is called the isoelectric point (pI). Most proteins’ solubilities decrease at the isoelectric point because the molecules no longer electrostatically repel each other in solution as much as when they carry a net overall positive or negative charge.
In this experiment, casein, which is the primary protein found in cow’s milk, will be isolated and its isoelectric point will be determined. In milk, which has a pH of approximately 6.6, casein is sparingly soluble, remaining as the white suspension typical of milk. This is however not the isoelectric point of casein and as pH is lowered, a significant amount of precipitation will occur.
Buffers
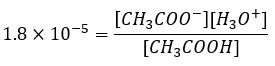
A buffer solution contains either a mixture of a weak acid and the salt of its conjugate base, eg., CH3COOH and CH3COO–Na+ or a mixture of a weak base and the salt of its conjugate acid, eg., NH3 and NH4+Cl–. Consider a buffer solution made up of CH3COOH and CH3COO–Na+. The equilibrium equation for acetic acid is:
![]()
Since acetic acid is a weak acid, the CH3COO– contribution from the acid in the buffer is small and the main source of this ion is sodium acetate (NaCH3COO). This salt ionizes completely in solution. The ionization constant of acetic acid is 1.81 x 10⁻⁵ mol/L.
 which when rearranged gives:
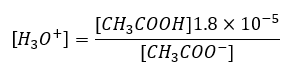 Therefore, to find the pH of a buffer solution made up of acetic acid and sodium acetate, the concentration of the acid and the salt must be known.
Suppose we start with 500 mL of a buffer solution that is 1.00 M in each of acetic acid and sodium acetate. From equation (2) we see that:
 Therefore [H3O+] = 1.81 x 10⁻⁵ and the pH = 4.74.
Materials
| Table of Contents | << previous section | next section >> |
| Reagent | Hazard Statements | |
| Hydrochloric Acid (~0.1 M) |   |
Corrosive
Irritant |
| Sodium Hydroxide (~0.1M) | |
Corrosive
Irritant |
| Acetic acid (~0.1 M) |  |
Flammable
Corrosive |
| Sodium Acetate | None | None |
| Glassware | Quantity |
| Beaker, 100 mL | 2 |
| Beaker, 250 mL | 2 |
| Cylinder, graduated 10 mL | 1 |
| Cylinder, graduated 100 mL | 1 |
| Cylinder, graduated 50 mL | 1 |
Pre-Lab Work
| Table of Contents | << previous section | next section >> |
A minimum of 24 hours before the start of your lab period:
- Watch the pre-lab video
- Complete and submit the pre-lab quiz for Experiment 7 on Avenue (under Assessments > Quizzes).
Prepare a flowchart (see here) of the experimental steps in your laboratory notebook. Take photos of these pages and upload them to the Exp 7 Pre-Lab Assignment folder (Assessments > Assignments)
Procedure
| Table of Contents | << previous section | next section >> |
Students will work in pairs for this experiment. Reports are prepared and submitted individually.
- Obtain a 15 mL sample of stock casein solution from your teaching assistant.
- Transfer the casein to the 250 mL beaker and dilute it with 20 mL of water.
- Add the magnetic stir bar and set the solution to a gentle stir on the stir plate (do not stir to quickly as the solution becomes frothy).
- Using a calibrated pH meter, slowly add 1.0 M HCl dropwise using a Pasteur pipette until the pH of the solution is ~ 7.00 (you should be within 0.5 pH units). If you overshoot the desired pH, use a small amount of diluted NaOH to raise the pH. This process can be tricky and may take more than one attempt. The more dilute you make the NaOH, the easier the process becomes (the goal is simply to have an approximate pH, so the exact concentration of NaOH is irrelevant). The solution might become slightly cloudy as the pH is lowered. This is fine, however if the casein precipitates you will need to get a new sample from your TA and start over.
- Take your casein solution and divide into equal parts to a maximum volume of 20 mL each. Label these beakers A and B, respectively. The solutions must be in 250 mL beakers to use of the pH meter. This may require you to transfer/clean/transfer solutions.
- Prepare 100 mL of 0.1 M HCl solution by diluting the 1.0 M stock solution in the larger graduated cylinder.
- Beaker A
- To the first half of the casein solution, add 10 mL DI water
- While stirring and measuring the pH, note the starting pH and volume reading in the burette before slowly add 0.1 M HCl via a burette
- Note the final volume and pH of the solution once you see the earliest stages of precipitate forming. The precipitate should persist in solution, even under stirring (the solution may appear cloudy or you may see actual particulate of casein).
- This pH is your isoelectric point (or “pI”)
- Beaker B:
- Prepare a buffer based on an acetic acid/acetate system with a total volume of 50 mL. The pH of the buffer must be 1.0 pH unit above the determined isoelectric point (but no more than 6.4). The concentration of the acetic acid and sodium acetate stock solutions will be equal, and the buffer solution can be made using a graduated cylinder. Check the pH of your buffer solution with the pH meter BEFORE adding it to your casein solution. What is the % error between theoretical calculations and actual pH?
- Add 10 mL of this buffer to the second half of the casein solution in Beaker B.
- While stirring and measuring the pH, note the starting pH and volume reading in the burette before slowly adding 0.1 M HCl via a burette.
- Add the same amount HCl that was added to precipitate the casein from the previous solution (to Beaker A). What do you notice? Continue adding HCl until the casein precipitates. Record the volume used.
- Dispose of chemical waste in the appropriate waste containers (see here).
- Rinse glassware with distilled water and return it to your drawer/station.
- Wipe down your lab bench with paper towels or a j-cloth.
Report
| Table of Contents | << previous section |
The report is done individually and prepared directly in your laboratory notebook. Be sure to include all results and observations including balanced chemical equations where appropriate.
- Show all calculations used to create the buffer solution of specified pH along with % error.
- What might be some reasons why the measured pH of your buffer is different from your calculated pH?
- Include all results including the difference in volume of HCl required to precipitate the casein and unbuffered versus buffered conditions and answer any questions appearing in the procedure
- Consult the report-writing guidelines on page v for additional details and requirements.
Have your TA sign and date every page of your data for this experiment. Within 1 hour of the end of your lab period, upload a single pdf of the images of your data pages and report to the appropriate Avenue Assignment folder (Assessments > Assignments > Experiment 7 Report). We recommend using the Microsoft Lens app for quick preparation of the final pdf.