Laboratory Information
Table of Contents
Level I Chemistry Lab Overview
| Table of Contents | next section >> |
Level I Chemistry Lab Overview
| Table of Contents | << previous section | next section >> |
Scheduling
- The laboratory program consists of 5 labs for the semester. See your Mosaic timetable for your scheduled day and time for each experiment.
- Please see your Avenue gradebook for your scheduled lab room (ABB 122A, 122B, 122C, or 126).
- Your laboratory period is scheduled for 2½ hours. You will be asked to leave at this point so the laboratory room can be prepared for the next group of students.
| Table of Contents | << previous section | next section >> |
Laboratory Materials
You are required to have the following items when coming to the laboratory:
- This laboratory manual with notebook pages, purchased at the campus store.
- Safety goggles, and appropriate attire (more information in the safety section).
- Pen, ruler, calculator, and a permanent marker (for labeling glassware).
- Pencil is only permitted when graphing.
| Table of Contents | << previous section | next section >> |
Arriving Late and Missed Work
- Students arriving late for a laboratory risk being turned away at the discretion of the teaching assistant or lab coordinator. Please review the course information sheets for further information on our missed work policy.
- Students unable to attend laboratories due to illness, or for other valid reasons, should also review our course information sheets for details on our missed work policy.
| Table of Contents | << previous section | next section >> |
Preparing for the Laboratory
- The laboratory manual should be read and well understood before your lab session. Any uncertainty in the procedure should be directed to a TA via the Avenue discussion boards or Help Desk.
- All students will complete a pre-lab quiz before coming to lab. This quiz is found on Avenue. You will need to complete an attempt on the pre-lab quiz prior to submitting your flowchart.
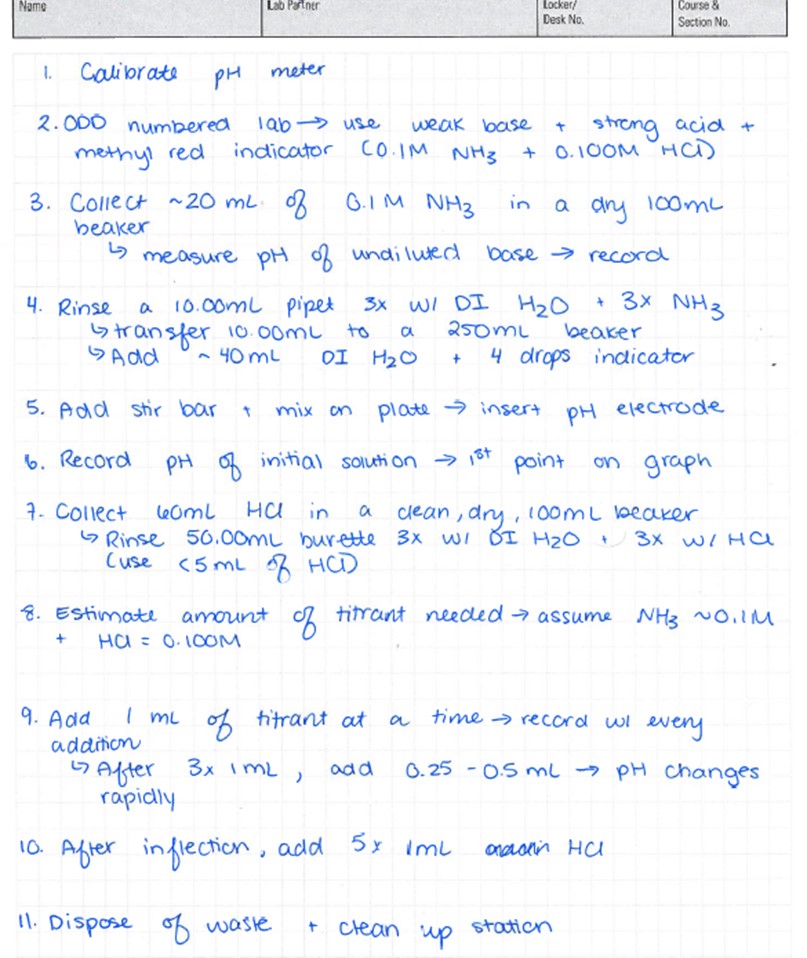
- Students will also prepare a flowchart of the experimental steps (see example in Figure 1). This is prepared directly in your laboratory notebook and images of these pages are submitted to Avenue a minimum of 24 hours before the start of the lab period. You cannot submit your flowchart until an attempt on the pre-lab quiz is completed.
- Preparation of a good flowchart will help you get the most out of your time spent in the laboratory. By reading and summarizing key steps of the experiment in advance of your lab period, you will complete the experiment faster and with greater understanding.
- A TA will grade it for accuracy and completeness. Please remember that flowcharts are to be done and submitted individually.
- Prepare any tables for summarizing observations and data in your notebook before coming to the lab. This will save you time during the lab period. Having reagent tables that outline the physical properties of reagents (MW, density, melting point) can be useful, if applicable.
| Table of Contents | << previous section | next section >> |
Writing Reports
Whether you work singly or in pairs, reports must be submitted individually. All experimental data must be recorded neatly in pen in the notebook pages of this manual. If an error is made, neatly cross out the incorrect value and write the correct value above or below. White-out, pencils and erasers have no place in a laboratory notebook.
If you wish to take “rough notes/data,” please do so in your laboratory notebook pages, not your manual pages or scrap paper. You are not required to hand in this work unless specifically required by the TA. Write legibly. A perfect experiment is of no use if it cannot be read.
In addition to the requirements requested for a specific experiment, all reports should contain the following information:
- Title, name, student number, date and partner’s name (if applicable).
- Changes to the experimental procedure if relevant.
- Observations/data section is composed of tables, charts and values that give a qualitative and quantitative description of what you see occurring during your experiment. This should include any solutions used in the experiment and their initial and final concentrations if pertinent.
- Sample calculations section should show one example of each type of calculation, in a logical and easy-to-follow way. All calculations should be labeled and should use the appropriate number of significant figures (see page 5). Only unique calculations need to be shown. If you are doing repetitive trials, tabulate results and only show calculations for one trial.
- The discussion section includes a clear and concise statement of results and an evaluation of potential sources of error. You may also answer any discussion questions posed in the lab manual.
- Proper sources of error include systematic deficiencies in techniques, materials or equipment that cannot be prevented. Human error is not a proper source of error. Any respectable scientist would repeat an experiment until all preventable errors were avoided. However, as time is limited, if a mistake was made, be specific and explain how the results would have been influenced.
- The exact formatting of reports is not rigid; however, two general guidelines should always be followed:
- The report must be clear, concise, well-organized and easy to follow. Someone with a general chemistry background, but not having done the experiment, should be able to read and understand the report with ease.
- The science must be correct. This does not mean you got the correct answer, but rather the observations/data obtained are explained, including any errors that may have influenced the results.
Significant Figures
Zeros
All nonzero digits are significant. Zeros are also significant with some notable exceptions:
- 0.0342—the underlined 0 is not significant as it is only a placeholder. This number is better expressed in scientific notation as 3.42 × 10⁻².
- 0.03420—the underlined 0 is significant in this case as it was specifically reported and not written with 3 significant figures as 0.0342.
- 3420—in this case, the underlined 0 is ambiguous. Is the 0 holding a place (3 sig fig), or does the author know, and is reporting the last digit (4 sig fig)? As written, since the 0 is ambiguous it is not considered significant. Therefore, the number has 3 significant figures, and to properly express to 4 significant figures should be written in scientific notation 3.420 × 10³ (or at times acceptable as 3420., where the decimal indicates any 0 to the left are significant).
In Calculations
- The result of multiplication or division may only contain as many significant figures as the value with the least amount of significant figures in the calculation.
Example: 134.4 × 12.67 × 14 = 2.4 × 10⁴
(4 sig figs × 4 sig figs × 2 sig figs = 2 sig figs)
- When adding and subtracting, the result must be expressed with the same number of
decimal places as the value with the smallest number of decimal places.
Example: 14.003 + 18.02 + 15.484 = 47.51
(3 decimal places + 2 decimal places + 3 decimal places = 2 decimal places)
- Logarithmic Calculations: When taking the log of a value, the number of significant figures in the calculation becomes the number of decimal places in the answer
Example: pKa = – log [1.85 x 10⁻⁵] = 4.732828272 ~ 4.733 (4 sig figs)
- Exact numbers are considered to have an unlimited number of significant figures.
Example: 1 minute = 60 s, counted quantities
(e.g., 6 faces on a cube, 2 hydrogen atoms in a water molecule)
Rounding Numerical Results
If we need to round off a number, the rule that is followed in your first-year Chemistry textbook is to increase the final digit by one unit if the digit dropped is 5, 6, 7, 8 or 9 and to leave the final digit unchanged if the digit dropped is 0, 1, 2, 3, or 4.
Graphing Experimental Data
Graphs provide a convenient method of illustrating a relationship between variables that have been measured in an experiment. Very often graphs are used to find functional (mathematical) relationships amongst measurements.
There are certain rules that must be followed when graphing experimental data.
- Only use the graph paper found in your lab notebook.
- All graphs should be landscape.
- Always give your graph a good, descriptive title.
- Example: If you are graphing the effect of temperature on the rate of a reaction, you may want to title your graph “The dependence of reaction rate of x on temperature”. A bad title may be: “Exp 8, Part A”.
- The x-axis of your graph is always your independent variable and the y-axis is the dependent variable.
- Example: For the temperature versus reaction rate graph, temperature would be on the x-axis and reaction rate would be on the y-axis, since it is dependent on temperature.
- Always label your x- and y-axes and make sure you include units.
- Example: For the above-mentioned graph, label your x-axis “Temperature (K)” and your y-axis “Rate of reaction (s–1)”.
- Scales should be chosen so that the graph comfortably fills the whole page. Try to use a “simple scale”, i.e., do not let 0.3 cm represent 1 degree if possible. It is not necessary that the origin of either axis start at zero unless it is important to know one of the intercept values graphically.
- Always make a line graph. Never use a bar graph for any chemistry-related material, except if you are explicitly told to do so.
- Do not connect the dots on your graph, unless you are told to do so. A line of best fit is usually used instead, as it can compensate for errors in the data.
- Make your graph as large as possible in the given space.
- Use a sharp pencil. Mark points in pencil and make them more visible by drawing (e.g., a circle or a triangle) around each point (see example on right hand side in
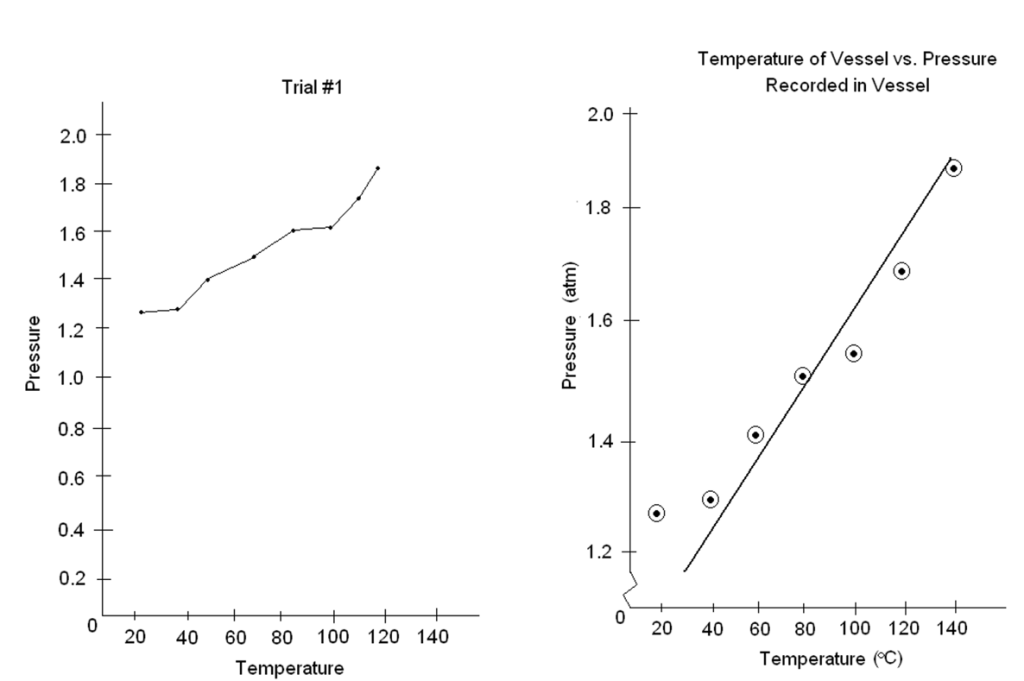
Figure 2 – Example of a poor graph (left) and a good graph (right). Can you spot the problems?
Slope Calculations
To calculate the slope of a straight line on a graph, choose two well-separated points that lie directly on the line. Do not choose two data points. The slope of a line between any two points (x1, y1) and (x2, y2) is given by
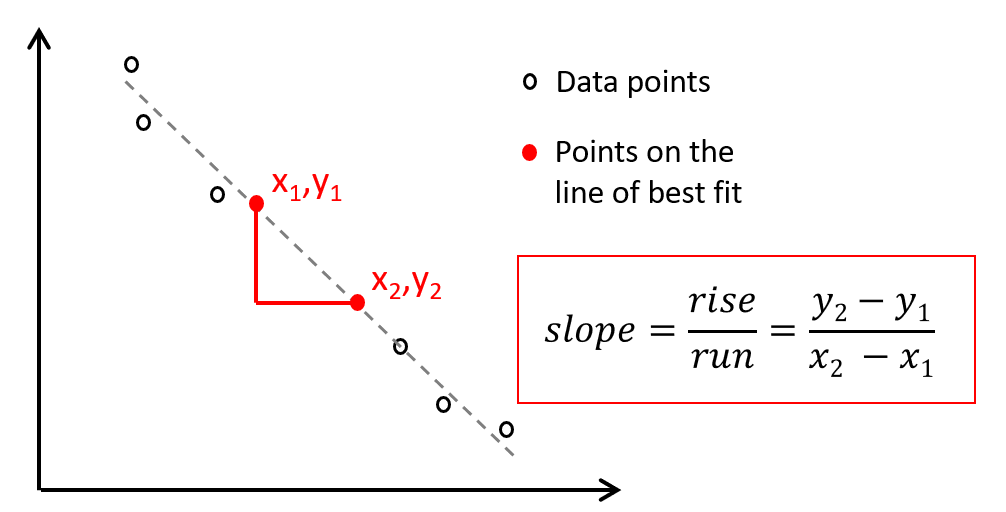
Figure 3 – Example Slope Calculation
The slope can also be defined as the change in the dependent variable (called the “rise”) divided by the change in the independent variable (called the “run”).
Note that the slope also has units corresponding to units of y per unit of x. If possible, slope calculations should be done directly on the graph paper in an uncluttered area.
| Table of Contents | << previous section | next section >> |
Academic Integrity
Students are expected to review and understand McMaster University’s policy on Academic Integrity:
http://www.mcmaster.ca/policy/Students-AcademicStudies/AcademicIntegrity.pdf
Some common issues related to the laboratory are outlined below.
- All students, regardless of individual or paired experiments, will hand in their own report.
- Reports and flowcharts are not to be plagiarized from other students or sources. Discussing, explaining, and paraphrasing (with references) are acceptable. Simply copying or providing answers is not. This includes pre-lab questions.
- Old laboratory reports or flowcharts of any form, or data not taken by the student during the experiment are not allowed.
- Students are only to use their data unless otherwise instructed by a teaching assistant or laboratory coordinator. If students are not using their own data, a reference to where the data was obtained, and why, is needed.
Report Submission
Lab reports are completed individually in lab. Your TA will sign and date all pages. Within 1 hour of the end of your lab period, upload a single pdf of the images of your data pages and report to the appropriate Avenue Assignment folder. We recommend using the Microsoft Lens app for quick preparation of the final pdf.