Experiment 6: Titrations
Table of Contents
Introduction
| Table of Contents | next section >> |
Indicators and Titrations
The hydrogen ion concentration of a solution may be measured in the laboratory by using a suitable indicator. The indicators to be used are weak organic acids with an acid ionization constant (KIn) which is dependent on the nature of the indicator. Consider, for example, methyl red which ionizes according to the equation:
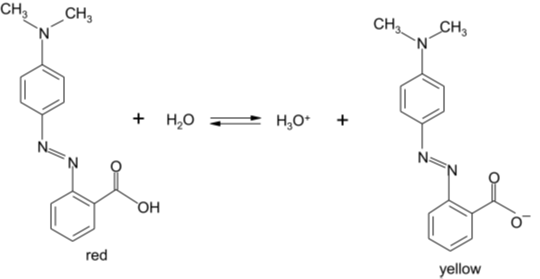 Figure 1 – Indicator Reaction
which we will abbreviate to:
HIn (acid) has one colour, In– (basic) has another colour. In a solution, if [H3O+] is large, then [HIn] >> [In–] and the indicator is substantially in the acid form and the solution has the colour of HIn, in this example, red. If [H3O+] is small, then [In–] >> [HIn] and the solution has the colour of In–, in this case, yellow.
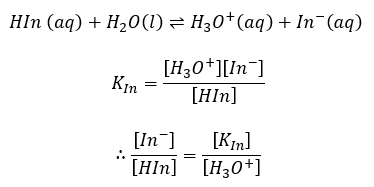
There is a natural limitation on the range of pH values over which a given indicator is useful. The eye can detect changes in colour only when the ratio of the concentrations for the two-coloured forms of the indicator falls in the range 0.1 to 10. When [In–]/[HIn] = 0.1, the solution is red; when [In–]/[HIn] = 1 (that is [In–] = [HIn]) the solution is orange, a colour intermediate between the acidic (red) and basic (yellow) colours. When [In–]/[Hin] = 10 the solution is distinctly yellow. By referring to the equilibrium constant expression, we can see that these ratios correspond to [H3O+] equal to 10 KIn, KIn and 0.1 KIn respectively. Therefore, this indicator is sensitive to change of pH only in a 100-fold range of H3O+ concentration which is centred on the value [H3O+] = KIn. In order to measure pH in the range of 7 ± 1, we must use an indicator which has an acid ionization constant of about 10-7 and likewise for other pH ranges. End point detection using an indicator is based on a colour change of the indicator as a result of concentration changes occurring near the equivalence point.
The equivalence point in acid-base titrations does not always occur at pH = 7. Thus, not all acid‑base titrations have an end point at pH = 7, and so the choice of a suitable indicator is very important.
In a strong acid‑strong base titration, there is a large change in pH near the equivalence point (If you want to check this, work out the pH of a titration of 100.00 of 0.100 M HCl, when 10.00 mL 0.100 M NaOH has been added, then when 99.9900 and 100.01 mL have been added) (Figure 14). Thus we can use any indicator which changes colour between pH 4‑10.
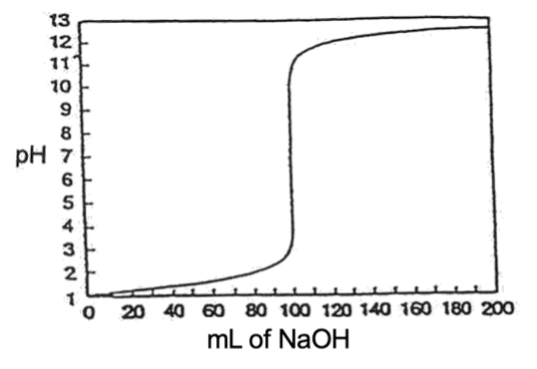
Figure 2 – Titration of a strong acid with a strong base (100.00 mL 0.100 M HCl + 0.100 M NaOH)
With a weak acid and a strong base, the solution will be basic at the equivalence point. In the titration of acetic acid with sodium hydroxide, for example, one has a solution of sodium acetate at the end point:
![]()
The solution is basic because the acetate ion is a weak base.
![]()
The slope of the curve at the equivalence point depends on the Ka of the acid. If the acid is very weak, the vertical part of the curve is much smaller (Figure 15). In this case the pH near the equivalence point changes quite slowly and makes the end point more difficult to observe.
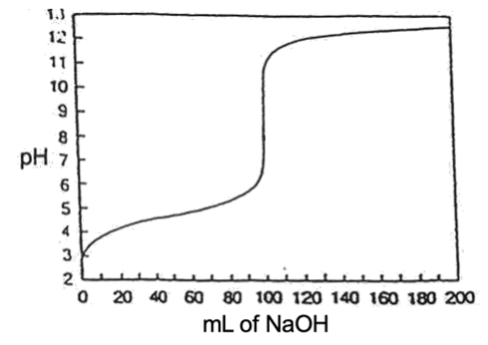
Figure 3 – Titration of a weak acid with a strong base (100.00 mL of 0.100 M CH3COOH with 0.100 M NaOH)
In the titration of a weak base with a strong acid, the solution is slightly acidic at the equivalence point. For example, in the titration of ammonia with HCl,
![]()
ammonium chloride is formed. The ammonium ion is a weak acid and gives an acid solution,
![]()
Indicators are useful in determining the approximate pH range or changes of pH (as in a titration). A more precise method for measuring the pH of a solution is the uses of a pH meter which employs an electrochemical cell. In this experiment both indicators and a pH meter will be used to study the pH of various solutions.
Determination of an Ionization Constant of a Weak Acid
A weak acid at moderate concentration in water will dissolve to a limited extent.
![]() The equilibrium constant for this reaction is:
The equilibrium constant for this reaction is:
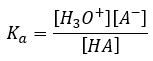
To determine the value of Ka it is necessary to find the values for [H3O+], [A–] and [HA] at equilibrium. If the source of H3O+ and A– is restricted to the weak acid (as in this experiment where acetic acid is the only solute) then at equilibrium [H3O+] = [A–]. The Ka expression now becomes:
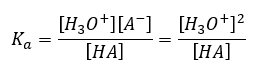
and the equilibrium value for [HA] would be [HA]o – [H3O+], where [HA]o is the concentration of HA if there were no dissociation (the initial concentration).
Materials
| Table of Contents | << previous section | next section >> |
| Reagent | Hazard Statements | |
| Hydrochloric Acid (~0.1 M) |   |
Corrosive
Irritant |
| Sodium Hydroxide (~0.1M) | |
Corrosive
Irritant |
| Ammonia (~0.1 M) |  |
Corrosive
Environmentally damaging Irritant |
| Acetic acid (~0.1 M) |  |
Flammable
Corrosive |
| Phenolphthalein |  |
Flammable
Irritant Health hazard (carcinogen) |
| Glassware | Quantity |
| Beaker, 100 mL | 2 |
| Beaker, 250 mL | 2 |
| Funnel, plastic | 1 |
| Pipet, volumetric, 10 mL | 1 |
| Reader, meniscus | 1 |
Pre-Lab Work
| Table of Contents | << previous section | next section >> |
A minimum of 24 hours before the start of your lab period:
- Watch the pre-lab video
- Complete and submit the pre-lab quiz for Experiment 6 on Avenue (under Assessments > Quizzes).
- Prepare a flowchart (see here) of the experimental steps in your laboratory notebook. Take photos of these pages and upload them to the Exp 6 Pre-Lab Assignment folder (Assessments > Assignments)
Procedure
| Table of Contents | << previous section | next section >> |
Calibrate the pH meter according to the instructions given in lab. For older pH meters, if the decimal place on your pH meter is not flashing, the meter is not actively reading. Make sure you press read!
In this experiment, you will use the pH meter to determine the titration curves for ONE of the following acid-base reactions.
- If you have an EVEN numbered lab section (e.g. L02, L04 etc.), you will react a weak acid with a strong base, [phenolphthalein indicator]: 0.1 M CH3COOH with 0.100 M NaOH
- If you have an ODD numbered lab section (e.g. L01, L03 etc.), you will react a weak base with a strong acid [methyl red indicator]; 0.1 M NH3 with 0.100 M HCl
Students who are doing part 1 should have 0.100 M NaOH in the burette, those who are doing part 2 should have 0.100 M HCl in the burette. It is a good idea this time to start your titration at the 0.00 mL mark on your burette.
- In a clean and dry 100 mL beaker, collect ~ 20 mL of either 0.1 M CH3COOH(aq) or 0.1 M NH3(aq). Make sure you label your beaker with the reagent name and concentration.
- Measure the pH of your undiluted weak acid or weak base solution – record this value in your notebook.
- Rinse a 10.00 mL pipet 3 times with DI water followed by 3x rinse with the solution from step 1.
- Transfer exactly 10.00 mL of the solution from step 1 into a 250 mL beaker using the 10.00 mL pipet.
- Add ~ 40 mL of DI water and 2 drops of the appropriate indicator.
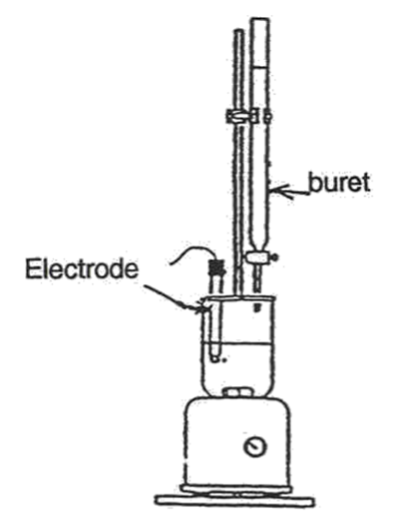
- Place the beaker on the stir plate and insert the electrode and magnetic stir bar. Turn on the stir plate ensuring that the stir bar does not collide with the electrode.
- Record the pH of the solution in the beaker. This is the first data point on your titration curve.
- Collect ~60 mL of either NaOH(aq) (titration 1) or HCl(aq) (titration 2) to a clean and dry 100 mL beaker. Label the beaker the reagent name and concentration.
- Rinse a 50.00 mL burette 3 times with small amounts (<10 mL) of DI water. Follow this with 3x rinsing with small amounts (<5 mL) of the solution collected in step 8 (herein referred to as the “titrant”).
- Estimate approximately, how many mL of titrant you will use to reach the equivalence point. Remember that the solution in your burette is exactly 0.100 M and the solution in the beaker is approximately 0.1 M.
- Start with adding 1 mL of titrant at a time and record the pH of the solution after each addition. After three 1 mL additions, decrease the amount of titrant from 1 mL increments to 0.2-0.5 mL (two to three drops at a time). The pH will start to change more rapidly – as it does this, lower the increments to accurately capture the inflection point of the curve.
- After reaching the inflection point, add 1 mL portions until you are at least 5 mL after the inflection point. Note: Sometimes the pH meter goes on Standby. If it does, press YES or READ.
- Dispose of chemical waste in the appropriate waste containers (see here).
- Rinse glassware with distilled water and return it to your drawer/station.
- Wipe down your lab bench with paper towels or a j-cloth.
| Note: It is necessary to plot the graph while doing the titration so that when the pH begins to change rapidly, the amount of titrant added can be reduced so the change in pH can be seen clearly on the graph. One member of the group can make the additions of titrant while the other plots the results on a graph. This will also help to finish the experiment on time. See here for guidelines of making graphs. |
Report
| Table of Contents | << previous section |
The report is done individually and prepared directly in your laboratory notebook. Be sure to include all results and observations including balanced chemical equations where appropriate.
Data Analysis
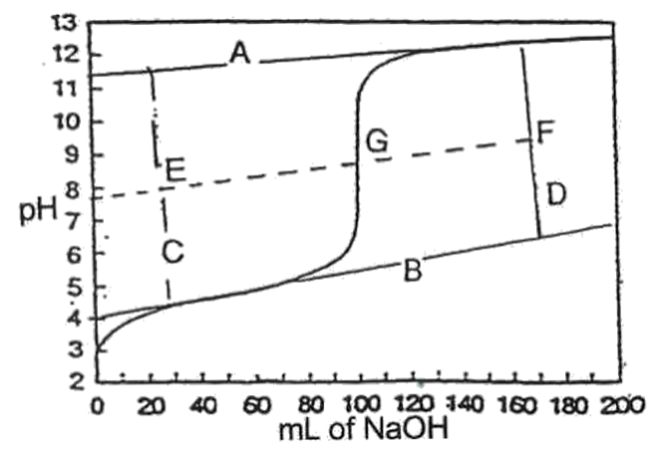
- Draw tangents to the “horizontal” parts of the curve. (lines A and B.)
- Connect these two lines by two perpendicular lines (C and D) one on each side of the vertical part of the curve.
- Connect the midpoints of lines C and D.
- The point where the line EF crosses the titration curve is the equivalence point G.
- Calculate the concentration of your unknown acid/base from your titration curve using the equivalence point. You are assuming you know the exact concentration of acid/base in your burette and the acid/base in your beaker is unknown. This will determine how accurate was the method and delivery. Mark the area where a buffer has formed on the appropriate titration curve.
- Use the graph to determine when the titration is half completed. Read the pH from the graph at the point where exactly one half of the volume of NaOH or HCl has been added to reach the equivalence point. At this point pH = pKa. To find the pKb (if you are using a weak base) you have to use Kw. Compare these results with the theoretical value by calculating a percent error.
- Calculate the Ka (or Kb) of your weak acid/base using the initial measured pH from before the solution was diluted. Compare this value to the value calculated from the graph.
- In your discussion, focus on concisely summarizing your results and attributing any discrepancies to valid sources of error. Propose ways you could avoid or correct those errors.
Have your TA sign and date every page of your data for this experiment. Within 1 hour of the end of your lab period, upload a single pdf of the images of your data pages and report to the appropriate Avenue Assignment folder (Assessments > Assignments > Experiment 6 Report). We recommend using the Microsoft Lens app for quick preparation of the final pdf.