Experiment 8: The Rate of a Chemical Reaction
Table of Contents
Introduction
| Table of Contents | next section >> |
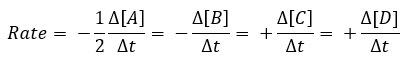
The rate of a reaction refers to how fast a given chemical reaction will occur. Consider the following reaction:
![]() The rate of the reaction can be measured by determining the rate of disappearance of any reactant or appearance of any product as a function of time:
The rate of the reaction can be measured by determining the rate of disappearance of any reactant or appearance of any product as a function of time:
Often, the overall effect of rate changes as a function of all reactants is an important feature for a reaction and is described by the rate law below:
![]()
In the rate law, k represents the rate constant, [A] & [B] the relative concentrations of these reactants and x & y (orders of reaction for A and B respectively) are generally small integers (though sometimes 0, negative or fractional) but are not necessarily related to the coefficients in the reaction and must be determined experimentally.
To determine the exponents x & y, a series of experiments can be developed where the concentration of one reactant is varied, while all others are kept the same. The resultant effect on the rate provides the value of x or y. As example, an experiment is designed that in trial 1, the concentrations of A and B are equal. In the 2nd trial, the concentration of A is doubled, while the concentration of B remains the same as trial 1. If the rate of the reaction doubled from trial 1 to 2, (as the doubling of A was the only factor), one can conclude x = 1. Similarly, if the rate quadrupled from trial 1 to 2, the value of x = 2. Mathematically the situation can be solved analytically as described below. (Note, you are not required to use this method, and may obtain the result qualitatively with reasoning if you choose.)
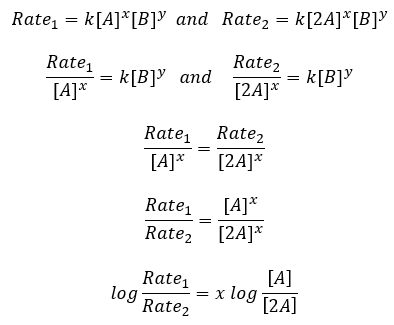
Rearrange and solve for .
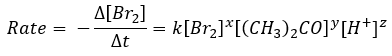
In today’s experiment the rate of bromination of acetone will be measured. The reaction is catalysed in an acidic medium:
![]()
By determining the rate of the reaction for different trials, where concentrations of each reactant are varied, the overall rate law can be determined (values of x, y & z).
To determine the rate of reaction, the change in concentration of bromine will be monitored over time using a spectrometer. Spectrometers measure absorbance of light passing through a sample. As absorbance is directly proportional to concentration, if an appropriate wavelength of light is chosen that corresponds to an absorbance of one reactant (395 nm for Br2), a graph of absorbance versus time can be plotted, with the slope being proportional to the rate of reaction. (The slope is not exactly equal, but rather proportional to the rate, as absorbance and concentration are related through a constant. For the purpose of this lab, the slope can be considered to be equal to the rate of reaction.)
To determine the exponent values of a, b & c in the rate law, a variety of trials will be performed where the concentration of each reactant is varied (with other reactant concentrations remaining constant). When selectively comparing the rate of reaction for each trial, the overall rate law can be found.
Materials
| Table of Contents | << previous section | next section >> |
| Reagent | Hazard Statements | |
| Hydrochloric Acid (1.0 M) |   |
Corrosive
Irritant |
| Bromine (~0.020 M) |   |
Causes severe skin burns and eye damage
Fatal if inhaled Very toxic to aquatic life |
| Acetone (~4.0 M) |  |
Flammable
Irritant |
| Glassware | Quantity |
| Beaker, 100 mL | 4 |
| Beaker, 250 mL | 1 |
| Test tube | 2 |
Pre-Lab Work
| Table of Contents | << previous section | next section >> |
A minimum of 24 hours before the start of your lab period:
- Watch the pre-lab video
- Complete and submit the pre-lab quiz for Experiment 8 on Avenue (under Assessments > Quizzes).
- Prepare a completed table of concentrations for the reagents used in trials 1 through 4 (see next page for initial concentrations and volumes)
- Prepare a flowchart (see here) of the experimental steps in your laboratory notebook. Take photos of these pages and upload them along with your completed table of concentrations to the Exp 8 Pre-Lab Assignment folder (Assessments > Assignments)
Procedure
| Table of Contents | << previous section | next section >> |
Students will work in pairs for this experiment. Reports are prepared and submitted individually.
| All mixing, preparation and disposal of solutions should be done in the fume hood with the exception of the bringing the cuvettes to the spectrophotometer. Goggles and gloves must be worn at all times. You will use an aqueous solution of bromine and while it is dilute all precautions should be taken to ensure your own and others safety. |
Setting up the spectrophotometer
There will be one spectrophotometer assigned for 2-3 groups. If the spectrophotometer has not been turned on, do so. Follow the instruction page next to the apparatus or those outlined in the special apparatus section. Set the wavelength to 395 nm.
To calibrate the spectrophotometer, fill a clean spec-tube (cuvette) around ¾ full with distilled water. Wipe the surface of the tube with a Kim wipe. If the spec-tube is not clean, you risk obtaining incorrect readings. Put the tube into the spectrophotometer and standardize it to 0 absorbance according to the instruction sheet.
Caution: Make sure that chemicals do not spill inside the machine.
Collecting data
You will do several trials with different concentrations of Br2, acetone, and HCl according to the table. You will need to cooperate with the other group who is using the spectrophotometer. While one group is taking the readings, the other group should be preparing solutions. Each group will prepare a whole set of solutions, according to the table:
| Trial # | 0.020 M Br2 | 4.0 M acetone | 1.0 M HCl | H2O |
| 1 | 5.0 mL | 5.0 mL | 5.0 mL | 10.0 mL |
| 2 | 10.0 mL | 5.0 mL | 5.0 mL | 5.0 mL |
| 3 | 10.0 mL | 5.0 mL | 10.0 mL | – |
| 4 | 10.0 mL | 10.0 mL | 5.0 mL | – |
For each trial, use the following procedure. Solutions should be prepared and stored in the fume hood:
- Measure the proper amount of acetone, hydrochloric acid and water. All three solutions should be poured into the same 100 mL beaker and mixed well.
- Add the necessary amount of Br2 solution to the same beaker and immediately start measuring the time. Make sure that the spectrophotometer is free for use. You will have only 45 seconds before starting the first reading on the spectrophotometer. For this, you will need to coordinate with the other group.
- Mix the solution well.
- Rinse the spec-tube with the solution and dump into the waste container labeled Halogenated Organic Waste.
- Fill 3/4 of the spec-tube with this solution and clean the outside of the tube with a Kim wipe. Place the tube into the spectrophotometer.
- Take the absorbance readings at 45sec, 60sec, 90sec, 120sec, 150sec and 180sec. Mixing solutions and timing should be done as precisely as possible.
- Steps 1-5 must be done in under 45secs. You should have your lab book near the spectrophotometer to write the absorbance.
- Dump the contents of the tube into the waste container when you are done.
- Begin with next sample.
- After all measurements are complete, dispose of chemical waste in the appropriate waste containers (see here).
- Rinse glassware with distilled water and return it to your drawer/station.
- Wipe down your lab bench with paper towels or a j-cloth.
Report
| Table of Contents | << previous section |
The report is done individually and prepared directly in your laboratory notebook. Be sure to include all results and observations including balanced chemical equations where appropriate.
The rate of this reaction is determined by the change of colour in the solution over a certain period of time. Absorbance readings are proportional to the intensity of colour, which is proportional to the concentration of bromine in the sample.
- Calculate the initial concentration of solutions used in each run. Remember that the total volume for each trial, after mixing all reagents should be 25.0 mL. Concentrations need to be calculated according to this volume. Record the result in a table like the one above. (This should have been done in the pre-lab)
- In your notebook, prepare two graphs of absorbance versus time. The first graph will show the data for trial #1, while the data for the remaining 3 trials are plotted on the second graph. Ensure the line for each trial is well distinguished and that each graph takes up a full page. Show the graphs to your TA.
- Give the reasoning for the statement that the rate of the reaction is equal to the slope of the graph for absorbance versus time of the reaction.
- Calculate the slope for each graph. Is the slope positive or negative? Comment.
- Using the obtained results, determine the order of the reaction with respect to each reagent. Show calculations.
- Write the expression for the rate of the reaction i.e., the rate law.
- Calculate the value of the rate constant, k, for each run.
- Calculate the overall reaction order and the units of k. Show calculations.
- Think about your experiment. Is the value of k the same or different for each trial? Why? What do you think can be done to improve your results?
- Consult the report-writing guidelines for additional details and requirements.
Have your TA sign and date every page of your data for this experiment. Within 1 hour of the end of your lab period, upload a single pdf of the images of your data pages and report to the appropriate Avenue Assignment folder (Assessments > Assignments > Experiment 8 Report). We recommend using the Microsoft Lens app for quick preparation of the final pdf.