Chapter 3 – The Cost of Logistics
3.1 Introduction
Strong competition in the open transportation market has driven down profit margins. Even though the profit margin per move in logistics transportation is often slim, the volume of opportunities is great. This combination of low margin and high volume can maximize profits. In a low-margin environment, understanding and controlling costs is imperative.
3.2 Learning Objectives
- Identify the cost for over-the-road moves.
- Understand how variable and fixed costs are applied in transportation.
3.3 Pre-Assessment
3.4 Logistics Cost
Logistics cost is simply the total cost of moving freight from one location to another. The definition does not need to be complicated. However, depending on the mode of transportation, the Incoterms, headhaul and backhaul opportunities, figuring out how to allocate and control costs can be confusing. When purchasing logistics services either directly or through a third party, determining the purchase price results from both market supply and demand. As a logistics professional, the ability to maximize profits is determined by finding the balance between cost from a service provider’s perspective and price from the service purchaser’s perspective.
The Service Provider Perspective
Depending on the mode of transportation, a logistics service provider (LSP) could be a trucking company, a shipping line, a railway, or an airline. This chapter will focus on trucking, also known as over-the-road transportation (OTR). Trucking, like all LSPs, has both fixed and variable costs. A key characteristic of the OTR industry is high variable costs and low fixed costs. The fact that roadways are funded through public revenues contributes significantly to the low fixed costs of the OTR industry. Approximately seventy percent of all costs in the OTR industry are variable costs and attributable to operational costs. (Atri & Murray, 2021)
Fixed costs in trucking are those expenses that will need to be paid regardless of whether or not the operation is hauling any freight. Examples of fixed and variable costs associated with trucking are listed in Table 3.1.
| Fixed | Variable |
|---|---|
| Equipment Lease costs (trucks, trailers,) | Labour (drivers) |
| Depreciation | Fuel |
| Office Leases or rent | Maintenance -parts and labour |
| Garage Leases or rent and/or Property tax | Roadway tolls |
| Interest on vehicles | Insurance, |
| Management costs (salaries) | LIcense, Registrations |
Fuel Surcharge
The cost of fuel is a significant variable cost for any OTR operation. In order to safeguard a motor carrier from operational losses caused by rising fuel costs, the industry has developed a Fuel Surcharge (FSC) formula to offset rising fuel costs. The premise behind the FSC is to pass along increasing fuel costs to the shipper. FSC is based on a peg rate and a national average of fuel costs per month. The difference between the peg rate and the national average diesel price is paid to the OTR carrier as an FSC. The FSC is added to the price of the freight move.
The Service Purchaser’s Perspective
A purchaser of logistics services is a company requiring freight to be transported from one location to another. Understanding the market rate for a move is imperative to operate an efficient supply chain. As a transportation service purchaser, the ideal outcome is to have goods delivered at the right time to the right location at the right price. Market factors such as supply and demand impact the price charged by OTR carriers. Truck driver supply dramatically affects the availability and price of OTR services. A buyer of logistics services needs to be in tune with crucial industry factors such as a truck driver shortage.
Further Reading: Truck Driver Availability
A new study into driver availability – Understanding the Truck Driver Supply and Demand Gap – was conducted by transportation consultants, CPCS. It updates the Canadian Trucking Alliance’s 2011 landmark report of the same name, which predicted a driver gap of up to 33,000 drivers by 2020: “the new study’s base case forecast calls for a shortage of 34,000 drivers by 2024 – reflecting an increase in demand of 25,000 and a decrease in supply of 9,000. The shortage could increase to 48,000 drivers based on plausible combinations of different trends that could affect industry demand, labour productivity and occupational attractiveness”(Canadian Trucking Alliance, 2016). Autonomous trucking technology can not come quick enough. An increase in OTR services is imminent and will be reflected in the availability and cost of consumer goods.
Autonomous Truck Technology
CNBC. (2019, April 13). How Amazon demand drives autonomous truck tech [Video]. YouTube. https://www.youtube.com/watch?v=vMXivgUGVn8&t=204s.
3.5 Breaking Down the Elements of Moving Freight
Understanding how to price a transportation move is not as straightforward as it may seem. Several factors must be considered when establishing a pricing model. First, every driver has a maximum number of driving hours and a maximum number of on-duty hours set per day and per week. Federally regulated driver rest time is mandated. All driving and rest hours must be recorded and maintained in the driver’s logbook. In today’s trucking industry, many logbooks are maintained electronically. Strategic decisions regarding driver configuration and service hours need to be considered before setting a price for a transportation move. Preceding the driver configuration decision is the challenge of fully understanding each component of delivering freight. Underestimating how the components of a freight move fit together and how to allocate a cost to each segment could be the difference between operating profitably or the LSP losing money.
Let’s break down the elements of a move.
- Deadhead or bobtail: moving the tractor without a trailer. This is often done at the beginning or end of a route. A truck or power unit is often parked in a terminal. The terminal is where a driver’s day starts/ends. This is also known in the industry as domiciled. A domicile is the service provider’s, the trucking company’s, registered place of business. A trucking company could have many terminals but only one domicile location.
- Freight pick up (PUD): freight pick up and delivery. The freight pick up strategy will depend on whether the load is priced as a live load, a drop and hook, or a terminal drop off.
- Live load: the driver backs into a dock with an empty trailer and waits while the freight is loaded. During a live load, the truck stays connected to the trailer.
- Drop and hook: the driver picks up a trailer of freight that has already been loaded and is waiting in the customer’s yard.
- Terminal pick up: the freight is loaded and transported by a PUD driver to a terminal, where the load awaits a highway driver to move the freight to the destination.
- Bill of lading (BOL) preparation: The driver picking up a load of freight cannot leave the loading facility until a bill of lading is prepared and issued to the driver. For a service provider, it is important to understand the customer’s procedures around bill of lading preparation. Every truck driver is bound by federally regulated operating service hours, and waiting for paperwork will reduce the number of hours a driver can be driving. There is a colloquialism in the trucking industry: “if the wheels ain’t turnin, no one is earnin”. This can be interpreted as any time wasted waiting for the bill of ladings or dock assignments is idle time and needs to be accounted for in the pricing model.
- Highway miles: After the freight is loaded and the BOL is prepared, the load is now ready to be transported to the delivery location. Isolating the highway miles from the PUD miles is a good business practice when pricing a move because the highway miles are the prime revenue-generating miles for a service provider.
- Freight delivery: Once the freight has reached the delivery location, the pricing model should consider the delivery methodology. Will the freight be live offloaded, dropped off in the customer’s yard, or will the freight be left in a terminal?
- Delivery instructions: The driver will wait for instructions at the delivery location regarding the load. Details such as where to park the load or which dock will receive the live load will be provided to the driver. Also, instructions on where to drop off the required delivery paperwork would be provided.
- Backhaul or deadhead: Once the freight is unloaded, the driver will either pick up a return load (a backhaul load) from the vendor or deadhead to the following trailer pickup location. If the driver is required to deadhead to the terminal, the distance from the customer to the terminal is a critical component to the pricing of that lane. Deadhead miles need to be considered into the costing model. If they are missed, the lane can quickly turn unprofitable.
Figure 3.1
Elements of a Move Flowchart
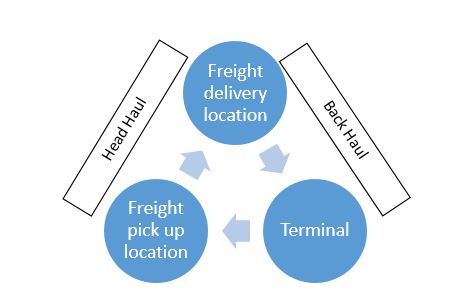
From Adzija, 2020.
Pricing an Over-The-Road (OTR) Move
As a service provider, ensuring both the headhaul and backhaul costs are captured in the cost model can be a challenging task. The headhaul is the movement of freight to the delivery location from the freight pick-up location. The pricing of the headhaul move includes both the fixed and variable costs (see Table 3.1). It also needs to include driving miles, waiting time, loading/unloading time, and potential traffic congestion. One function of the route planning team is to review the likelihood of securing a paid backhaul load.
Backhaul is the return of the truck, trailer, and driver to the point of origin (terminal). If the freight contract stipulates that both the headhaul and backhaul legs of a move are included in the route, pricing each leg of the lane becomes easier. If, however, only the headhaul leg of the move is included in the contract, then it is up to the service provider to figure out a way to return the driver, trailer, and tractor to the point of origin of the load. To minimize lost revenue, trucking service providers will price backhaul loads aggressively. Often carriers will cost the fixed costs of a move in the headhaul and only price the variable costs in the backhaul move. Ideally, from the service providers’ perspective, the ability to return a load to the origination point by linking several headhaul moves would be most profitable, but this is not always achievable.
Cost Per Mile, Cost Per Pound, Cost Per Hour or a Combination?
Most often, full truckloads are priced on a rate-per-mile basis. The service provider needs to calculate a rate per mile for headhaul loads and a separate rate-per-mile for the backhaul portion. Frequently trucking companies will establish a required annual rate-per-mile that must be driven to break even. Equipment utilization and rate-per-mile have an inverse relationship. As equipment utilization increases and nears 100 percent, the required breakeven rate-per-mile decreases.
Less than truckload (LTL) pricing per load is based on either the weight of the freight, cubic size, or a combination of both. Often LTL loads include an element of load consolidation, and as such, computing the required cost per pound involves a material-handling element. Due to the complexity of coordinating the elements of an LTL shipment, the cost is higher than a full truckload shipment.
Charging an hourly rate for trucking is often associated with a shunting service or short PUD shipments.
Driver Configuration
Another decision point for the service provider is configuring the operator/driver component of a move. A single driver configuration occurs when one driver will complete the entire move from the point of origination, shipment pick up, delivery, and return. The single driver stays with the equipment for the duration of the move.
A slip seat move involves two or more operators. Each driver will operate the equipment for a set time interval – usually based upon the maximum allowable drive hours—and then a new driver will switch or relieve the previous driver.
Tandem or team drivers operate similarly to a slip seat move; however, both drivers stay with the equipment in a team driver approach. One driver rests in the cab while the other driver operates the truck in this configuration. Once driver A has exhausted their hours, driver B continues the route, and driver A rests in the cab or sleeper unit. An important note is that a tandem team is paid by the mile as a whole; each driver is not paid separately by the mile.
Route Planning
For a trucking company, effective route planning is critical. The ability to link headhaul and backhaul loads will maximize equipment utilization, revenue generation, and operator compensation. “If the wheels aren’t turnin’, no one is earnin'” applies here, meaning that freight needs to be moving from location to location loaded, minimizing deadhead miles so that a service provider can optimize revenue. The operation will lose revenue if a route has too many deadhead moves or inefficient slip seat driver exchange locations.
Fleet Management and Equipment Consideration
One element that a service purchaser underestimates is the trailer requirements of a service provider. Depending on the type of delivery agreement (drop and hook or live unload), the number of trailers required to fulfill a delivery requirement could fluctuate—the greater number of trailers required to service a customer, the greater the equipment cost. The greater the equipment cost, the greater the cost per mile charge required to break even. In a live unload/reload scenario, the driver remains attached to the truck. In this type of delivery, one trailer is sufficient to service the customer. However, if the contract calls for a drop and hook delivery, a minimum of two trailers are required to service the customer. If the contract also calls for dunnage delivery, the contract could require three or more trailers to service the contract.
Understanding Lanes
When a logistics provider is responding to a request for a quote or invited to provide a bid, the bid is often based on a delivery route, also known as a lane. A service purchaser often specifies the delivery lane requirements. For example, if an OEM requires a truckload of product picked up in Toronto, Ontario, Canada and delivered to London, Ontario, Canada, that would constitute a lane. The lane could be a return route or a single leg. A return route means that the service provider would be required to pick up in Toronto, deliver to London and return to Toronto – this could be classified as one complete turn. Assuming this is a live unload, let’s look closer at this lane.
Example: Toronto to London and Return Lane
The origination of the load is Toronto resulting in 1 hour to load the trailer. Delivery to London, Ontario is 2 hours. Freight unloading and dunnage reloaded will take 1 hour. The return trip to Toronto will take another 2 hours, and offloading the dunnage 1 hour. The route is completed.
The total time dedicated to the route is 7 hours with 4 hours of drive time.
Drivers have 11 hours of drive time available in a 14-hour time period (Ontario Ministry of Transportation, 2021). Equipment is available for use 24 hours per day. From a utilization perspective, this route would utilize a driver 36 percent (4hrs/11hours) of available drive time. The equipment is only 30 percent utilized (7 hours/24 hours). A driver utilization of 36% and equipment utilization of 30% is mediocre. The service provider would look to their route planning and fleet management team to add routes to this lane to maximize driver and equipment utilization. If the service provider cannot add additional lanes to this route, the cost per mile would need to be calculated based on the low utilization rates. Often low utilization will result in a cost-prohibitive bid.
Window Times
A window time is a pre-arranged appointment to deliver or pick up freight. Usually, a service provider only has a +/- 15 minute grace period to the window time. If the truck driver misses the assigned window time, they will need to wait until the supplier has dock availability. Waiting and delays are costly to a service provider. Missed window times can be caused by suppliers not having a receiving dock available at the prescribed window time. The service provider needs to establish a fee schedule for delayed dock availability.
Further Reading: Keeping Current
Visit the American Transportation Research Institute and review the An Analysis of the Operational Costs of Trucking: 2021 Update [opens a PDF file].
The American Transportation Research Institute is a great resource and contains many trending trucking topics.
3.6 Summary
Establishing the cost of delivering freight contains many variables. Missing one of the variables could turn a potentially profitable lane into an unprofitable freight move. Data capturing technology is helping carriers analyze moves, highlight problem areas, and problem solve in real-time. Using all the tools available in today’s trucking industry is imperative if a company is to stay profitable.
3.7 Post Assessment (Check Your Understanding)
3.8 Chapter References
Atri, L., & Murray, D. (2021, November 23). An analysis of the operational costs of trucking: 2021 update. American Transportation Research Institute. https://truckingresearch.org/2021/11/23/an-analysis-of-the-operational-costs-of-trucking-2021-update/
CNBC. (2019). How Amazon Demand Drives Autonomous Truck Tech [YouTube]. Retrieved December 21, 2021, from https://www.youtube.com/watch?v=vMXivgUGVn8&t=204s.
Canadian Trucking Alliance. (2016, June 14). CTA study: Truck Driver Shortage Accelerating – Canadian Trucking Alliance. https://cantruck.ca/truck-driver-shortage-accelerating-according-to-new-cta-study/
Ontario Ministry of Transportation. (2021, May 9). The official Ministry of Transportation (MTO) truck handbook: Hours of service. https://www.ontario.ca/document/official-ministry-transportation-mto-truck-handbook/hours-service
