5.4 Calculating Probabilities for a Normal Distribution
LEARNING OBJECTIVES
- Recognize the normal probability distribution and apply it appropriately.
- Calculate probabilities associated with a normal distribution.
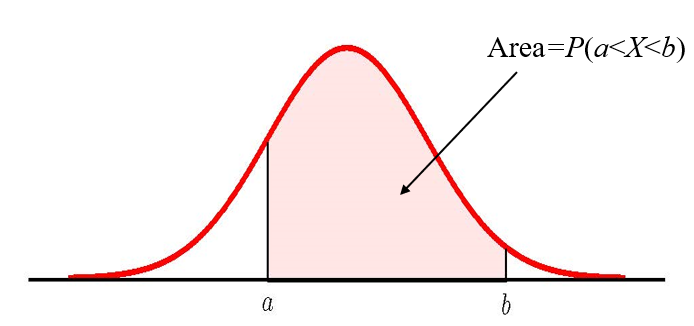
Probabilities for a normal random variable [latex]X[/latex] equal the area under the corresponding normal distribution curve. The probability that the value for [latex]X[/latex] falls in between the values [latex]x=a[/latex] and [latex]x=b[/latex] is the area under the normal distribution curve to the right of [latex]x=a[/latex] and to the left of [latex]x=b[/latex].
CALCULATING NORMAL PROBABILITIES IN EXCEL
To calculate probabilities associated with normal random variables in Excel, use the norm.dist(x,[latex]\mu[/latex],[latex]\sigma[/latex],logic operator) function.
- For x, enter the value for [latex]x[/latex].
- For [latex]\mu[/latex], enter the mean of the normal distribution.
- For [latex]\sigma[/latex], enter the standard deviation of the normal distribution.
- For the logic operator, enter true. Note: Because we are calculating the area under the curve, we always enter true for the logic operator.
The output from the norm.dist function is the probability that [latex]X \lt x[/latex]. That is the output from the norm.dist function is the area to the left of the value of x.
Visit the Microsoft page for more information about the norm.dist function.
NOTE
The norm.dist function always tells us the area to the left of the value entered for x.
- To find the area to the right of the value of x, we use 1-norm.dist(x,[latex]\mu[/latex],[latex]\sigma[/latex],true). This corresponds to the probability that [latex]X \gt x[/latex].
- To find the area in between x1 and x2 with [latex]x_1 \lt x_2[/latex], we use norm.dist(x2,[latex]\mu[/latex],[latex]\sigma[/latex],true)-norm.dist(x1,[latex]\mu[/latex],[latex]\sigma[/latex],true). This corresponds to the probability that [latex]x_1 \lt X \lt x_2[/latex].
An alternative approach in Excel is to use the norm.s.dist(z,true) function. In the norm.s.dist function, we enter the z-score for the corresponding value of x and the output will be the area to the left x.
CALCULATING [latex]\color{white}{x}[/latex]-VALUES FOR A NORMAL DISTRIBUTION IN EXCEL
Given the area to the left of an (unknown) [latex]x[/latex]-value, use the norm.inv(probability,[latex]\mu[/latex],[latex]\sigma[/latex]) function.
- For probability, enter the area to the left of [latex]x[/latex].
- For [latex]\mu[/latex], enter the mean of the normal distribution.
- For [latex]\sigma[/latex], enter the standard deviation of the normal distribution.
The output from the norm.inv function is the value of [latex]x[/latex] so that the area to left of [latex]x[/latex] equals the given probability. That is the output from the norm.inv function is the value of [latex]x[/latex] so that the [latex]P(X \lt x)=\text{probability}[/latex].
Visit the Microsoft page for more information about the norm.inv function.
NOTE
The norm.inv function requires that we enter the area to the left of the unknown [latex]x[/latex]-value. If we are given the area to the right of the unknown [latex]x[/latex]-value, we enter 1-area to the right for the probability in the norm.inv function. That is, given the area to the right of the [latex]x[/latex]-value, we use norm.inv(1-area,[latex]\mu[/latex],[latex]\sigma[/latex]).
EXAMPLE
The final exam scores in a statistics class are normally distributed with a mean of [latex]63[/latex] and a standard deviation of [latex]5[/latex].
- Find the probability that a randomly selected student scored more than [latex]65[/latex] on the exam.
- Find the probability that a randomly selected student scored less than [latex]75[/latex] on the exam.
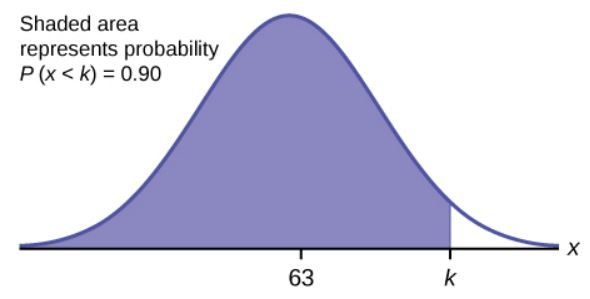
- [latex]90\%[/latex] of the students scored less than what value?
- [latex]30\%[/latex] of the students scored more than what value?
Solution
Let [latex]X[/latex] be the scores on the final exam.
- We want to find [latex]P(X\gt65)[/latex]:
Function 1-norm.dist Field 1 65 Field 2 63 Field 3 5 Field 4 true Answer 0.3446 The probability that a student scores more than [latex]65[/latex] is [latex]0.3446[/latex] (or [latex]34.46\%[/latex]).

- We want to find [latex]P(X\lt75)[/latex]:
Function norm.dist Field 1 75 Field 2 63 Field 3 5 Field 4 true Answer 0.9918 The probability that a student scores less than [latex]75[/latex] is [latex]0.9918[/latex] (or [latex]99.18\%[/latex]).
- We want to find the value of [latex]x[/latex] so that the area to the left of [latex]x[/latex] is [latex]0.9[/latex].
Function norm.inv Field 1 0.9 Field 2 63 Field 3 5 Answer 69.41 [latex]90\%[/latex] of the students scored below [latex]69.41[/latex] points on the exam.
- We want to find the value of [latex]x[/latex] so that the area to the right of [latex]x[/latex] is [latex]0.3[/latex]. This is the same as finding the value of [latex]x[/latex] so that the area to the left of [latex]x[/latex] is [latex]0.7[/latex] ([latex]1-0.3[/latex]).
Function norm.inv Field 1 0.7 Field 2 63 Field 3 5 Answer 65.62 [latex]30\%[/latex] of the students scored more [latex]65.62[/latex] points on the exam.

TRY IT
The golf scores for a school team are normally distributed with a mean of [latex]68[/latex] and a standard deviation of [latex]3[/latex].
- Find the probability that a randomly selected golfer scored less than [latex]65[/latex].
- Find the probability that a randomly selected golfer scored more than [latex]72[/latex].
Click to see Solution
-
Function norm.dist Field 1 65 Field 2 68 Field 3 3 Field 4 true Answer 0.1587 -
Function 1-norm.dist Field 1 72 Field 2 68 Field 3 3 Field 4 true Answer 0.0912
EXAMPLE
A personal computer is used for office work at home, research, communication, personal finances, education, entertainment, social networking, and a myriad of other things. Suppose that the average number of hours a household personal computer is used for entertainment is [latex]2[/latex] hours per day. Assume the times for entertainment are normally distributed, and the standard deviation for the times is [latex]0.5[/latex] hour.
- Find the probability that a household personal computer is used for entertainment between [latex]1.8[/latex] and [latex]2.75[/latex] hours per day.
- Find the number of hours per day for the bottom [latex]25\%[/latex] of households using a personal computer for entertainment.
Solution
Let [latex]X[/latex] be the amount of time (in hours) a household personal computer is used for entertainment.
- We want to find [latex]P(1.8 \lt X \lt 2.75)[/latex].
Function norm.dist -norm.dist Field 1 2.75 1.8 Field 2 2 2 Field 3 0.5 0.5 Field 4 true true Answer 0.5886 The probability a household computer is used for entertainment between [latex]1.8[/latex] and [latex]2.75[/latex] hours a day is [latex]0.5886[/latex] (or [latex]58.86\%[/latex]).

- We need to find the value [latex]x[/latex] so that [latex]25\%[/latex] of the number of hours as less than this value.
Function norm.inv Field 1 0.25 Field 2 2 Field 3 0.5 Answer 1.66 [latex]25\%[/latex] of the value are less than [latex]1.66[/latex] hours.


TRY IT
The golf scores for a school team are normally distributed with a mean of [latex]68[/latex] and a standard deviation of [latex]3[/latex]. Find the probability that a golfer scored between [latex]66[/latex] and [latex]70[/latex].
Click to see Solution
| Function | norm.dist | -norm.dist |
|---|---|---|
| Field 1 | 70 | 66 |
| Field 2 | 68 | 68 |
| Field 3 | 3 | 3 |
| Field 4 | true | true |
| Answer | 0.4950 |
EXAMPLE
There are approximately one billion smartphone users in the world today. In the United States, the ages of smartphone users from 13 to 55+ follow a normal distribution with approximate mean and standard deviation of [latex]36.9[/latex] years and [latex]13.9[/latex] years, respectively.
- Determine the probability that a random smartphone user in the age range 13 to 55+ is between [latex]23[/latex] and [latex]64.7[/latex] years old.
- Determine the probability that a randomly selected smartphone user in the age range 13 to 55+ is at most [latex]50.8[/latex] years old.
- [latex]80\%[/latex] of the users in the age range 13 to 55+ are less than what age?
- [latex]40\%[/latex] of the ages that range from 13 to 55+ are at least what age?
Solution
-
Function norm.dist -norm.dist Field 1 64.7 23 Field 2 36.9 36.9 Field 3 13.9 13.9 Field 4 true true Answer 0.8186 The probability a smartphone user is between [latex]23[/latex] and [latex]64.7[/latex] years of age is [latex]0.8186[/latex] (or [latex]81.86\%[/latex]).
-
Function norm.dist Field 1 50.8 Field 2 36.9 Field 3 13.9 Field 4 true Answer 0.8413 The probability that a smartphone user is less than [latex]50.8[/latex] years of age is [latex]0.8413[/latex] (or [latex]84.13\%[/latex]).
-
Function norm.inv Field 1 0.8 Field 2 36.9 Field 3 13.9 Answer 48.6 [latex]80\%[/latex] of the smartphone users in the age range 13 – 55+ are [latex]48.6[/latex] years old or less.
-
Function norm.inv Field 1 0.6 Field 2 36.9 Field 3 13.9 Answer 40.42 [latex]40\%[/latex] of the smartphone users in the age range 13 – 55+ are older than [latex]40.42[/latex] years of age.
TRY IT
There are approximately one billion smartphone users in the world today. In the United States, the ages of smartphone users from 13 to 55+ follow a normal distribution with approximate mean and standard deviation of [latex]36.9[/latex] years and [latex]13.9[/latex] years, respectively.
- [latex]30\%[/latex] of smartphone users are older than what age?
- What is the probability that the age of a randomly selected smartphone user in the range of 13 to 55+ is less than [latex]27[/latex] years old?
Click to see Solution
-
Function norm.inv Field 1 0.7 Field 2 36.9 Field 3 13.9 Answer 44.19 -
Function norm.dist Field 1 27 Field 2 36.9 Field 3 13.9 Field 4 true Answer 0.2382
EXAMPLE
A citrus farmer who grows mandarin oranges finds that the diameters of mandarin oranges harvested on his farm follow a normal distribution with a mean diameter of [latex]5.85[/latex] cm and a standard deviation of [latex]0.24[/latex] cm.
- Find the probability that a randomly selected mandarin orange from this farm has a diameter larger than [latex]6.0[/latex] cm.
- [latex]90\%[/latex] of the diameters of the mandarin oranges are less than what value?
- [latex]35\%[/latex] of the diameters of the mandarin oranges are greater than what value?
Solution
-
Function 1-norm.dist Field 1 6 Field 2 5.85 Field 3 0.24 Field 4 true Answer 0.2660 The probability an orange has a diameter greater than [latex]6[/latex] cm is [latex]0.2660[/latex] (or [latex]26.60\%[/latex]).
-
Function norm.inv Field 1 0.9 Field 2 5.85 Field 3 0.24 Answer 6.16 [latex]90\%[/latex] of the diameters of the oranges are less than [latex]6.16[/latex] cm.
-
Function norm.inv Field 1 0.65 Field 2 5.85 Field 3 0.24 Answer 5.94 [latex]35\%[/latex]of the diameters of the oranges are greater than [latex]5.94[/latex] cm.
Video: "Excel 2013 Statistical Analysis #39: Probabilities for Normal (Bell) Probability Distribution" by excelisfun [24:08] is licensed under the Standard YouTube License.Transcript and closed captions available on YouTube.
Exercises
- If the area to the left of [latex]x[/latex] in a normal distribution is [latex]0.123[/latex], what is the area to the right of [latex]x[/latex]?
Click to see Answer
[latex]0.877[/latex]
- If the area to the right of [latex]x[/latex] in a normal distribution is [latex]0.543[/latex], what is the area to the left of [latex]x[/latex]?
Click to see Answer
[latex]0.457[/latex]
- Suppose [latex]X[/latex] is a normal random variable with a mean of [latex]54[/latex] and a standard deviation of [latex]8[/latex].
- Find the probability that [latex]x \gt 56[/latex].
- Find the probability that [latex]x \lt 30[/latex].
- Find the probability that [latex]40 \lt x \lt 50[/latex].
- [latex]80\%[/latex] of the [latex]x[/latex]-values are less than what value?
- [latex]40\%[/latex] of the [latex]x[/latex]-values are greater than what value?
Click to see Answer
- [latex]0.4013[/latex]
- [latex]0.0014[/latex]
- [latex]0.2685[/latex]
- [latex]60.73[/latex]
- [latex]56.03[/latex]
- The life of Sunshine CD players is normally distributed with a mean of [latex]4.1[/latex] years and a standard deviation of [latex]1.3[/latex] years.
- Find the probability that a CD player will last between [latex]2.8[/latex] and [latex]6[/latex] years.
- Find the probability that a CD player will last more than [latex]7.5[/latex] years.
- A CD player is guaranteed for three years. Find the probability that a CD player will break down during the guarantee period.
- [latex]70\%[/latex] of the CD players last how long?
- [latex]10\%[/latex] of the CD players will last more than how many years?
Click to see Answer
- [latex]0.7694[/latex]
- [latex]0.0045[/latex]
- [latex]0.1987[/latex]
- [latex]4.78[/latex] years
- [latex]5.77[/latex] years
- The patient recovery time from a particular surgical procedure is normally distributed with a mean of [latex]5.3[/latex] days and a standard deviation of [latex]2.1[/latex] days.
- What is the probability of spending more than two days in recovery?
- What is the probability of spending between four and seven days in recovery?
- What percentage of patients spend fewer than three days in recovery?
- [latex]10\%[/latex] of the recovery times are larger than what value?
Click to see Answer
- [latex]0.9420[/latex]
- [latex]0.5230[/latex]
- [latex]0.1367[/latex]
- [latex]7.99[/latex] days
- The length of time it takes to find a parking space at 9 A.M. follows a normal distribution with a mean of [latex]5[/latex] minutes and a standard deviation of [latex]2[/latex] minutes.
- Would you be surprised if it took less than one minute to find a parking space? Justify your answer
- Find the probability that it takes at least eight minutes to find a parking space.
- [latex]70\%[/latex] of the time, it takes more than how many minutes to find a parking space?
- [latex]25\%[/latex] of the time, it takes fewer than how many minutes to find a parking space?
Click to see Answer
- Yes, because the probability of finding a parking space in less than one minute is only [latex]0.0228[/latex]
- [latex]0.0668[/latex]
- [latex]3.95[/latex] minutes
- [latex]3.65[/latex] minutes
- According to a study done by De Anza students, the height for Asian adult males is normally distributed with an average of [latex]66[/latex] inches and a standard deviation of [latex]2.5[/latex] inches.
- Find the probability that a randomly selected Asian adult male is between [latex]65[/latex] and [latex]69[/latex] inches.
- Would you expect to meet many Asian adult males over [latex]72[/latex] inches? Justify your answer.
- [latex]20\%[/latex] of Asian adult males are shorter than what value?
- [latex]40\%[/latex] of Asian adult males are taller than what value?
Click to see Answer
- [latex]0.5404[/latex]
- No, because the probability an Asian adult male is taller than [latex]72[/latex] inches is only [latex]0.0083[/latex]
- [latex]63.9[/latex] inches
- [latex]66.63[/latex] inches
- IQ is normally distributed with a mean of [latex]100[/latex] and a standard deviation of [latex]15[/latex]. Suppose one individual is randomly chosen.
- Find the probability that a randomly chosen person has an IQ greater than [latex]120[/latex].
- Find the probability that a randomly chosen person has an IQ less than [latex]85[/latex].
- MENSA is an organization whose members have the top [latex]2\%[/latex] of all IQs. Find the minimum IQ needed to qualify for the MENSA organization.
Click to see Answer
- [latex]0.0918[/latex]
- [latex]0.1587[/latex]
- [latex]130.81[/latex]
- The percent of fat calories that a person in America consumes each day is normally distributed with a mean of [latex]36[/latex] and a standard deviation of [latex]10[/latex].
- Find the probability that the percent of fat calories a person consumes is more than [latex]40[/latex].
- Find the probability that the percent of fat calories a person consumes is between [latex]50[/latex] and [latex]60[/latex].
- [latex]25\%[/latex] of people consume less than what percent of fat calories?
- [latex]5\%[/latex] of people consume more than what percent of fat calories?
Click to see Answer
- [latex]0.3446[/latex]
- [latex]0.0726[/latex]
- [latex]29.26\%[/latex]
- [latex]52.45\%[/latex]
- Suppose that the distance of fly balls hit to the outfield (in baseball) is normally distributed with a mean of [latex]250[/latex] feet and a standard deviation of [latex]50[/latex] feet.
- What is the probability that a random fly ball travels fewer than [latex]220[/latex] feet?
- Would you expect many fly balls to travel more than [latex]400[/latex] feet? Justify your answer.
- What percentage of fly balls travel between [latex]300[/latex] and [latex]350[/latex] feet?
- [latex]80\%[/latex] of fly balls travel for less than what distance?
- [latex]30\%[/latex] of fly balls travel for more than what distance?
Click to see Answer
- [latex]0.2743[/latex]
- No, because the probability that a fly ball travels more than [latex]400[/latex] feet is only 0.0013
- [latex]0.1359[/latex]
- [latex]292.08[/latex] feet
- [latex]276.22[/latex] feet
- Suppose that the duration of a particular type of criminal trial is known to be normally distributed with a mean of [latex]21[/latex] days and a standard deviation of [latex]7[/latex] days.
- Find the probability that a randomly selected trial lasted at least [latex]24[/latex] days.
- Find the probability that a randomly selected trial lasted between [latex]10[/latex] and [latex]30[/latex] days.
- Find the probability that a randomly selected trial lasted at most [latex]5[/latex] days.
- [latex]60\%[/latex] of all trials of this type are completed within how many days?
- [latex]15\%[/latex] of all trials of this type take longer than how many days?
Click to see Answer
- [latex]0.3341[/latex]
- [latex]0.8427[/latex]
- [latex]0.0111[/latex]
- [latex]22.77[/latex] days
- [latex]28.26[/latex] days
- Terri Vogel, an amateur motorcycle racer, averages [latex]129.71[/latex] seconds per [latex]2.5[/latex] mile lap (in a seven-lap race) with a standard deviation of [latex]2.28[/latex] seconds. The distribution of her race times is normally distributed.
- Find the percent of her laps that are completed in less than [latex]130[/latex] seconds.
- Find the percent of her laps that are completed in more than [latex]137[/latex] seconds.
- Find the percent of her laps that are completed between [latex]125[/latex] and [latex]135[/latex] seconds.
- The fastest [latex]3\%[/latex] of her laps are under what value?
- The slowest [latex]5\%[/latex] of her laps are more than what value?
Click to see Answer
- [latex]0.5506[/latex]
- [latex]0.0007[/latex]
- [latex]0.9704[/latex]
- [latex]125.42[/latex] seconds
- [latex]133.46[/latex] seconds
"5.5 Calculating Probabilities for a Normal Distribution" and “5.6 Exercises” from Introduction to Statistics by Valerie Watts is licensed under a Creative Commons Attribution-NonCommercial-ShareAlike 4.0 International License, except where otherwise noted.
