Data-Informed Design
Wise & Jung (2019) present an Initial Model of Analytics Use:
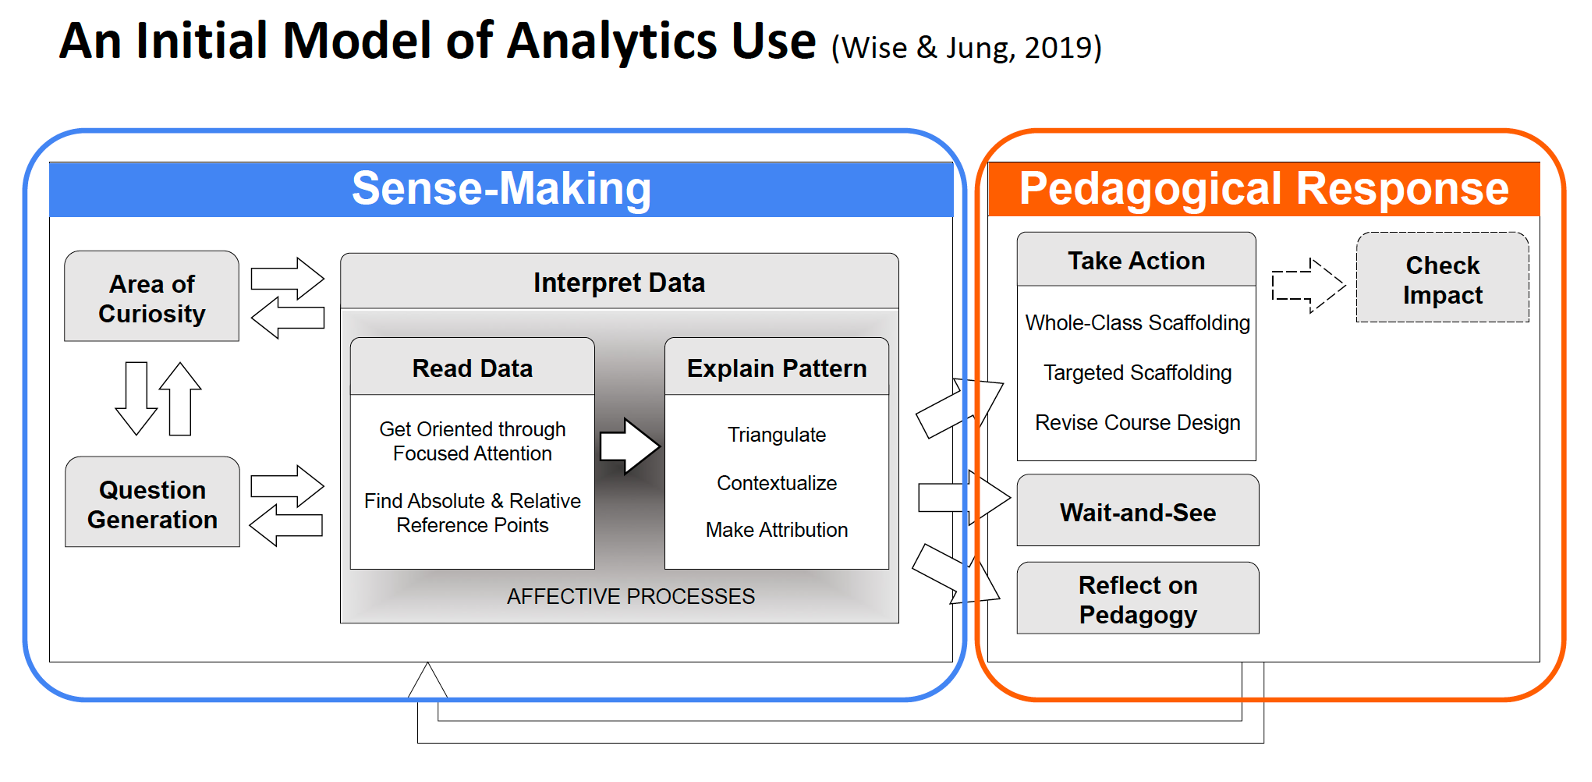
Building on this model, the video below explores a framework for data-informed design in teaching and learning environments.
Featuring Laurie Harrison – Director, Digital Learning Innovation, University of Toronto
https://www.youtube.com/watch?v=NvB0AUQtJaU
Generating and Workshopping Questions
When working with data, it’s important to critically examine our questions, consider our assumptions and expectations of the data, and anticipate challenges, opportunities, and questions related to our areas of curiosity. The interactive slides below aim to capture some of this process. Groups of participants were given questions related to teaching and learning, and workshopped them together. Some of the dialogue is captured in the audio files and transcripts below:
You can use the worksheet below to capture some of your questions related to learning analytics and data. On the final page, you can export a copy to continue your work.
Worksheet
Media Attributions
- Teaching with Analytics: Towards a Situated Model of Instructional Decision-Making © Wise and Jung (2019) is licensed under a CC BY-NC-ND (Attribution NonCommercial NoDerivatives) license
