14.6 Hearing
Learning Objectives
By the end of this section, you will be able to:
- Define hearing, pitch, loudness, timbre, note, tone, phon, ultrasound, and infrasound.
- Compare loudness to frequency and intensity of a sound.
- Identify structures of the inner ear and explain how they relate to sound perception.

Figure 14.33 Hearing allows these vocalists, the band, and the fans to enjoy music. Image from OpenStax College Physics 2e, CC-BY 4.0
The human ear has a tremendous range and sensitivity. It can give us a wealth of simple information—such as pitch, loudness, and direction. And from its input we can detect musical quality and nuances of voiced emotion. How is our hearing related to the physical qualities of sound, and how does the hearing mechanism work?
Hearing is the perception of sound. (Perception is commonly defined to be awareness through the senses, a typically circular definition of higher-level processes in living organisms.) Normal human hearing encompasses frequencies from 20 to 20,000 Hz, an impressive range. Sounds below 20 Hz are called infrasound, whereas those above 20,000 Hz are ultrasound. Neither is perceived by the ear, although infrasound can sometimes be felt as vibrations. When we do hear low-frequency vibrations, such as the sounds of a diving board, we hear the individual vibrations only because there are higher-frequency sounds in each. Other animals have hearing ranges different from that of humans. Dogs can hear sounds as high as 30,000 Hz, whereas bats and dolphins can hear up to 100,000-Hz sounds. You may have noticed that dogs respond to the sound of a dog whistle which produces sound out of the range of human hearing. Elephants are known to respond to frequencies below 20 Hz.
The perception of frequency is called pitch. Most of us have excellent relative pitch, which means that we can tell whether one sound has a different frequency from another. Typically, we can discriminate between two sounds if their frequencies differ by 0.3% or more. For example, 500.0 and 501.5 Hz are noticeably different. Pitch perception is directly related to frequency and is not greatly affected by other physical quantities such as intensity. Musical notes are particular sounds that can be produced by most instruments and in Western music have particular names. Combinations of notes constitute music. Some people can identify musical notes, such as A-sharp, C, or E-flat, just by listening to them. This uncommon ability is called perfect pitch.
The ear is remarkably sensitive to low-intensity sounds. The lowest audible intensity or threshold is about [latex]\text{10}^{- \text{12}} \text{W}/\text{m}^{2}[/latex] or 0 dB. Sounds as much as [latex]\text{10}^{\text{12}}[/latex] more intense can be briefly tolerated. Very few measuring devices are capable of observations over a range of a trillion. The perception of intensity is called loudness. At a given frequency, it is possible to discern differences of about 1 dB, and a change of 3 dB is easily noticed. But loudness is not related to intensity alone. Frequency has a major effect on how loud a sound seems. The ear has its maximum sensitivity to frequencies in the range of 2000 to 5000 Hz, so that sounds in this range are perceived as being louder than, say, those at 500 or 10,000 Hz, even when they all have the same intensity. Sounds near the high- and low-frequency extremes of the hearing range seem even less loud, because the ear is even less sensitive at those frequencies. Table 14.4 gives the dependence of certain human hearing perceptions on physical quantities.
| Perception | Physical quantity |
|---|---|
| Pitch | Frequency |
| Loudness | Intensity and Frequency |
| Timbre | Number and relative intensity of multiple frequencies. Subtle craftsmanship leads to non-linear effects and more detail. |
| Note | Basic unit of music with specific names, combined to generate tunes |
| Tone | Number and relative intensity of multiple frequencies. |
A unit called a phon is used to express loudness numerically. Phons differ from decibels because the phon is a unit of loudness perception, whereas the decibel is a unit of physical intensity. Figure 14.34 shows the relationship of loudness to intensity (or intensity level) and frequency for persons with normal hearing. The curved lines are equal-loudness curves. Each curve is labeled with its loudness in phons. Any sound along a given curve will be perceived as equally loud by the average person. The curves were determined by having large numbers of people compare the loudness of sounds at different frequencies and sound intensity levels. At a frequency of 1000 Hz, phons are taken to be numerically equal to decibels. The following example helps illustrate how to use the graph:
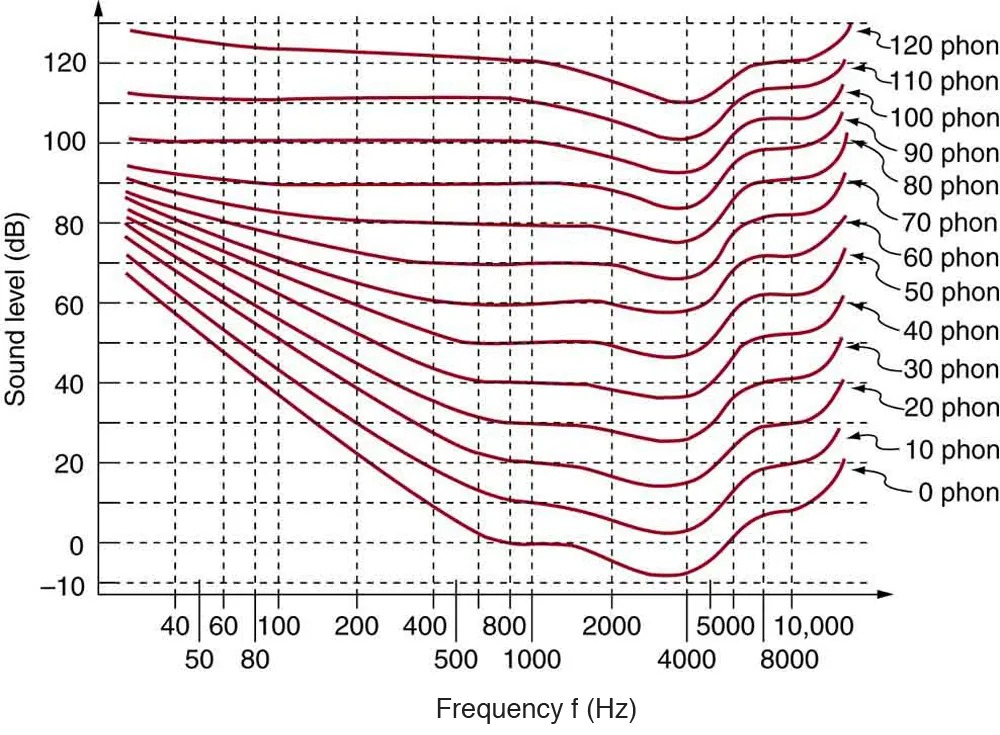
Figure 14.34 The relationship of loudness in phons to intensity level (in decibels) and intensity (in watts per meter squared) for persons with normal hearing. The curved lines are equal-loudness curves—all sounds on a given curve are perceived as equally loud. Phons and decibels are defined to be the same at 1000 Hz. Image from OpenStax College Physics 2e, CC-BY 4.0
Image Description
This image is a graph showing equal-loudness contours, which illustrate the sound level in decibels (dB) required to produce a perception of equal loudness at different frequencies measured in Hertz (Hz). The horizontal axis represents frequency ranging from 20 Hz to 10,000 Hz, while the vertical axis represents sound level ranging from -10 dB to 120 dB.
The graph includes multiple contour lines labeled from 0 phon to 120 phon, representing perceived loudness levels. The contours vary in shape, generally rising at low frequencies and higher frequencies, indicating variations in human hearing sensitivity across frequencies. Each line is marked with its corresponding phon value on the right side of the graph.
The contours demonstrate how the human ear perceives different frequencies at various loudness levels, highlighting that more sound level is needed at lower frequencies to be perceived as equally loud compared to higher frequencies.
Example 14.6
Measuring Loudness: Loudness Versus Intensity Level and Frequency
(a) What is the loudness in phons of a 100-Hz sound that has an intensity level of 80 dB? (b) What is the intensity level in decibels of a 4000-Hz sound having a loudness of 70 phons? (c) At what intensity level will an 8000-Hz sound have the same loudness as a 200-Hz sound at 60 dB?
Strategy for (a)
The graph in Figure 14.34 should be referenced in order to solve this example. To find the loudness of a given sound, you must know its frequency and intensity level and locate that point on the square grid, then interpolate between loudness curves to get the loudness in phons.
Solution for (a)
(1) Identify knowns:
- The square grid of the graph relating phons and decibels is a plot of intensity level versus frequency—both physical quantities.
- 100 Hz at 80 dB lies halfway between the curves marked 70 and 80 phons.
(2) Find the loudness: 75 phons.
Strategy for (b)
The graph in Figure 14.34 should be referenced in order to solve this example. To find the intensity level of a sound, you must have its frequency and loudness. Once that point is located, the intensity level can be determined from the vertical axis.
Solution for (b)
(1) Identify knowns:
- Values are given to be 4000 Hz at 70 phons.
(2) Follow the 70-phon curve until it reaches 4000 Hz. At that point, it is below the 70 dB line at about 67 dB.
(3) Find the intensity level:
67 dB
Strategy for (c)
The graph in Figure 14.34 should be referenced in order to solve this example.
Solution for (c)
(1) Locate the point for a 200 Hz and 60 dB sound.
(2) Find the loudness: This point lies just slightly above the 50-phon curve, and so its loudness is 51 phons.
(3) Look for the 51-phon level is at 8000 Hz: 63 dB.
Discussion
These answers, like all information extracted from Figure 14.34, have uncertainties of several phons or several decibels, partly due to difficulties in interpolation, but mostly related to uncertainties in the equal-loudness curves.
Further examination of the graph in Figure 14.34 reveals some interesting facts about human hearing. First, sounds below the 0-phon curve are not perceived by most people. So, for example, a 60 Hz sound at 40 dB is inaudible. The 0-phon curve represents the threshold of normal hearing. We can hear some sounds at intensity levels below 0 dB. For example, a 3-dB, 5000-Hz sound is audible, because it lies above the 0-phon curve. The loudness curves all have dips in them between about 2000 and 5000 Hz. These dips mean the ear is most sensitive to frequencies in that range. For example, a 15-dB sound at 4000 Hz has a loudness of 20 phons, the same as a 20-dB sound at 1000 Hz. The curves rise at both extremes of the frequency range, indicating that a greater-intensity level sound is needed at those frequencies to be perceived to be as loud as at middle frequencies. For example, a sound at 10,000 Hz must have an intensity level of 30 dB to seem as loud as a 20 dB sound at 1000 Hz. Sounds above 120 phons are painful as well as damaging.
We do not often utilize our full range of hearing. This is particularly true for frequencies above 8000 Hz, which are rare in the environment and are unnecessary for understanding conversation or appreciating music. In fact, people who have lost the ability to hear such high frequencies are usually unaware of their loss until tested. The shaded region in Figure 14.35 is the frequency and intensity region where most conversational sounds fall. The curved lines indicate what effect hearing losses of 40 and 60 phons will have. A 40-phon hearing loss at all frequencies still allows a person to understand conversation, although it will seem very quiet. A person with a 60-phon loss at all frequencies will hear only the lowest frequencies and will not be able to understand speech unless it is much louder than normal. Even so, speech may seem indistinct, because higher frequencies are not as well perceived. The conversational speech region also has a gender component, in that female voices are usually characterized by higher frequencies. So the person with a 60-phon hearing impediment might have difficulty understanding the normal conversation of a woman.
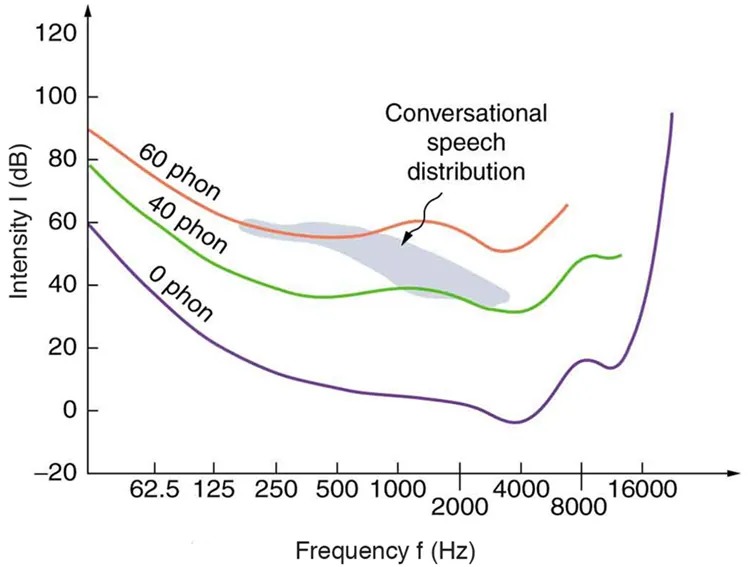
Figure 14.35 The shaded region represents frequencies and intensity levels found in normal conversational speech. The 0-phon line represents the normal hearing threshold, while those at 40 and 60 represent thresholds for people with 40- and 60-phon hearing losses, respectively. Image from OpenStax College Physics 2e, CC-BY 4.0
Image Description
The image is a graph showing the relationship between frequency (in Hz) and intensity (in dB) with three curves labeled as 0 phon, 40 phon, and 60 phon. The x-axis represents frequency on a logarithmic scale, ranging from 62.5 Hz to 16000 Hz. The y-axis represents intensity, ranging from -20 dB to 120 dB.
The curves trace the threshold of hearing at various phon levels:
- The 0 phon curve, in purple, begins at higher dB levels for lower frequencies and slopes downward before rising steeply at higher frequencies.
- The 40 phon curve, in green, follows a similar pattern but at higher dB levels than the 0 phon curve.
- The 60 phon curve, in orange, also follows the same pattern but is displaced upward higher along the dB axis.
A shaded area labeled “Conversational speech distribution” is present between approximately 200 Hz and 4000 Hz on the frequency axis, indicating the range where conversational speech typically occurs within these phon levels.
Hearing tests are performed over a range of frequencies, usually from 250 to 8000 Hz, and can be displayed graphically in an audiogram like that in Figure 14.36. The hearing threshold is measured in dB relative to the normal threshold, so that normal hearing registers as 0 dB at all frequencies. Hearing loss caused by noise typically shows a dip near the 4000 Hz frequency, irrespective of the frequency that caused the loss and often affects both ears. The most common form of hearing loss comes with age and is called presbycusis—literally elder ear. Such loss is increasingly severe at higher frequencies, and interferes with music appreciation and speech recognition.
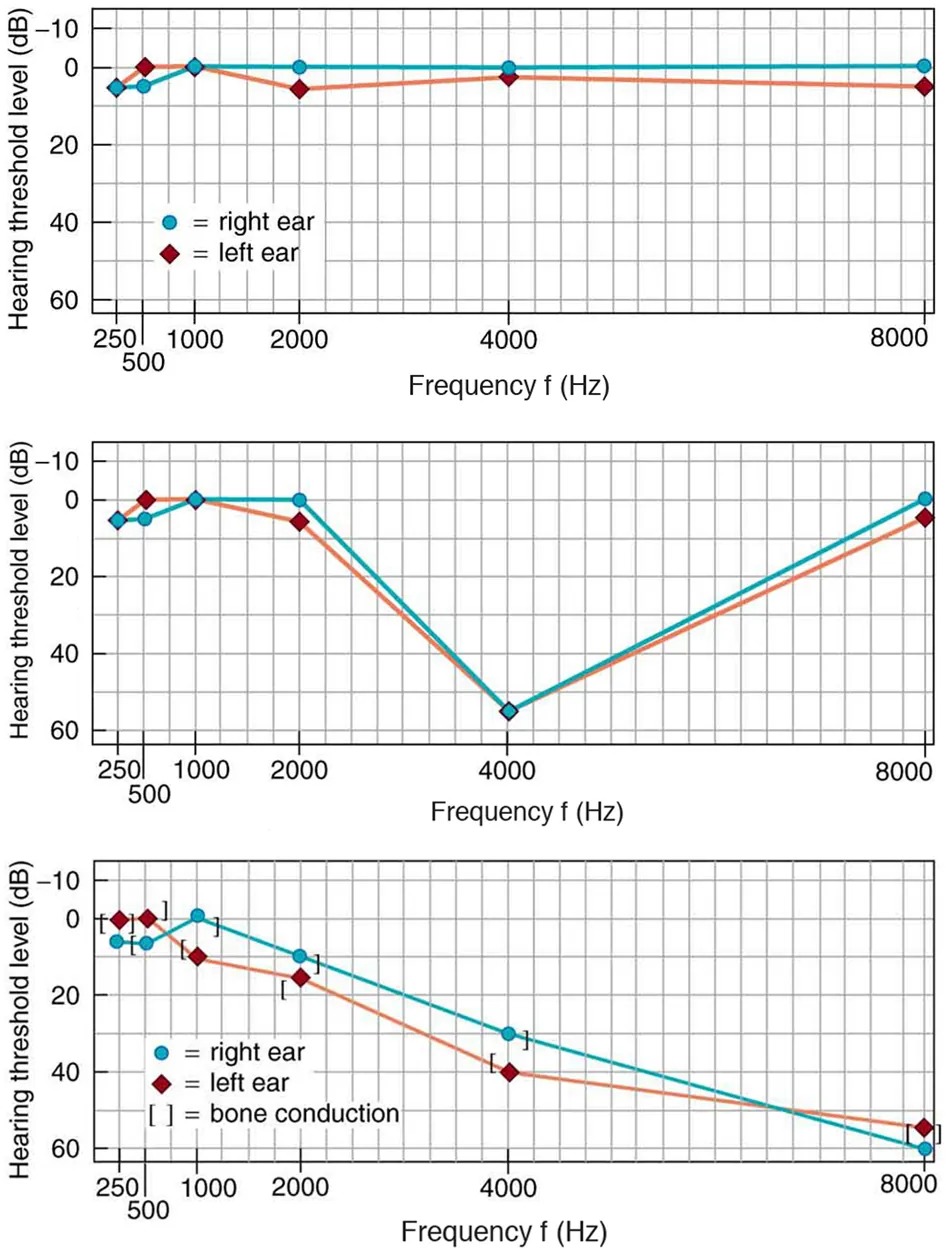
Figure 14.36 Audiograms showing the threshold in intensity level versus frequency for three different individuals. Intensity level is measured relative to the normal threshold. The top left graph is that of a person with normal hearing. The graph to its right has a dip at 4000 Hz and is that of a child who suffered hearing loss due to a cap gun. The third graph is typical of presbycusis, the progressive loss of higher frequency hearing with age. Tests performed by bone conduction (brackets) can distinguish nerve damage from middle ear damage. Image from OpenStax College Physics 2e, CC-BY 4.0
Image Description
This image contains three audiogram charts displaying hearing threshold levels measured in decibels (dB) across a range of frequencies in hertz (Hz) for both the right and left ears.
First Chart: This chart plots hearing thresholds from 250 Hz to 8000 Hz with two lines representing the right ear (blue circles) and left ear (red diamonds). Hearing levels are between -10 dB and 0 dB for both ears, with minimal differences between the two.
Second Chart: Similar to the first, this chart presents hearing thresholds from 250 Hz to 8000 Hz for the right ear (blue circles) and left ear (red diamonds). Both ears have a V-shaped pattern, with lower threshold levels at 250-2000 Hz, a peak at 4000 Hz, and a return to lower thresholds at 8000 Hz.
Third Chart: This chart also covers 250 Hz to 8000 Hz, with right ear (blue circles and brackets for bone conduction) and left ear (red diamonds). There is a gradual increase in threshold levels for both ears, particularly noticeable in bone conduction measurements, with higher thresholds towards 8000 Hz.
All charts are annotated with legends that describe symbols: blue circles for the right ear, red diamonds for the left ear, and brackets indicating bone conduction in the third chart.
The Hearing Mechanism
The hearing mechanism involves some interesting physics. The sound wave that impinges upon our ear is a pressure wave. The ear is a transducer that converts sound waves into electrical nerve impulses in a manner much more sophisticated than, but analogous to, a microphone. Figure 14.37 shows the gross anatomy of the ear with its division into three parts: the outer ear or ear canal; the middle ear, which runs from the eardrum to the cochlea; and the inner ear, which is the cochlea itself. The body part normally referred to as the ear is technically called the pinna.
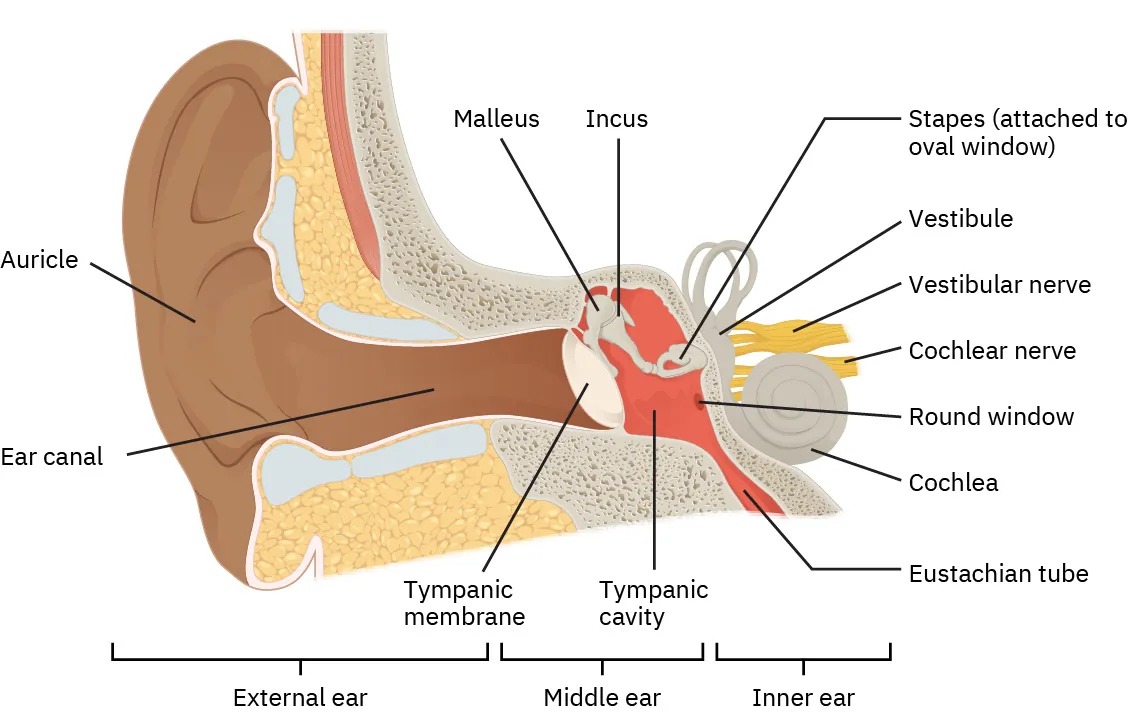
Figure 14.37 The illustration shows the gross anatomy of the human ear. Image from OpenStax College Physics 2e, CC-BY 4.0
Image Description
This image is an anatomical diagram of the human ear, showing a cross-section of its three main parts: the external ear, the middle ear, and the inner ear.
- External Ear:
- Auricle – The outermost visible part.
- Ear Canal – The passage leading to the eardrum.
- Middle Ear:
- Tympanic Membrane (eardrum) – Separates the external ear from the middle ear.
- Tympanic Cavity – Air-filled cavity behind the tympanic membrane.
- Malleus – A small bone attached to the tympanic membrane.
- Incus – The bone connecting the malleus to the stapes.
- Stapes (attached to oval window) – The bone that connects to the inner ear.
- Inner Ear:
- Vestibule – Central part of the inner ear.
- Vestibular Nerve – Transmits balance information to the brain.
- Cochlear Nerve – Transmits sound signals to the brain.
- Round Window – A membrane near the cochlea.
- Cochlea – Spiral-shaped organ responsible for hearing.
- Eustachian Tube – Connects the middle ear to the throat.
The diagram also indicates the location of each part within the three sections of the ear: external, middle, and inner.
The outer ear, or ear canal, carries sound to the recessed protected eardrum. The air column in the ear canal resonates and is partially responsible for the sensitivity of the ear to sounds in the 2000 to 5000 Hz range. The middle ear converts sound into mechanical vibrations and applies these vibrations to the cochlea. The lever system of the middle ear takes the force exerted on the eardrum by sound pressure variations, amplifies it and transmits it to the inner ear via the oval window, creating pressure waves in the cochlea approximately 40 times greater than those impinging on the eardrum. (See Figure 14.38.) Two muscles in the middle ear (not shown) protect the inner ear from very intense sounds. They react to intense sound in a few milliseconds and reduce the force transmitted to the cochlea. This protective reaction can also be triggered by your own voice, so that humming while shooting a gun, for example, can reduce noise damage.
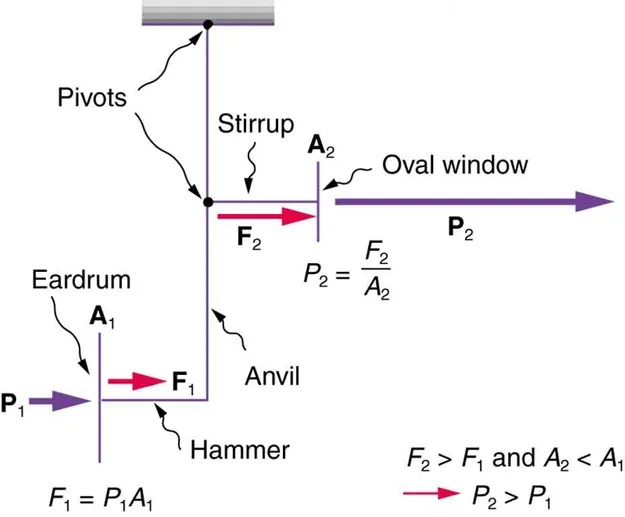
Figure 14.38 This schematic shows the middle ear’s system for converting sound pressure into force, increasing that force through a lever system, and applying the increased force to a small area of the cochlea, thereby creating a pressure about 40 times that in the original sound wave. A protective muscle reaction to intense sounds greatly reduces the mechanical advantage of the lever system. Image from OpenStax College Physics 2e, CC-BY 4.0
Image Description
The image is a diagram showing the process of sound transmission through the middle ear. It illustrates how the mechanics of the ear amplify sound pressure from the eardrum to the oval window. Here’s a description of each part and the flow of action:
- Eardrum: Labeled with ‘A1‘ and ‘P1‘, where ‘F1‘ is the force applied. The eardrum receives the initial sound pressure ‘P1‘.
- Hammer: Connected to the eardrum and attached to the next component, the Anvil.
- Anvil: Transfers the vibrations from the hammer to the stirrup.
- Stirrup: Labeled with ‘A2‘ and ‘F2‘, showing a greater force than ‘F1‘.
- Oval Window: Receives the sound transmitted from the stirrup with pressure ‘P2‘.
The diagram further provides the relationship between forces and areas:
‘F1 = P1A1‘ and ‘P2 = F2/A2.’
Additionally, it highlights the relationships:
- ‘F2 > F1‘ and ‘A2 < A1‘.
- ‘P2 > P1‘.
The system of “Pivots” indicates points of leverage facilitating the transmission dynamics.
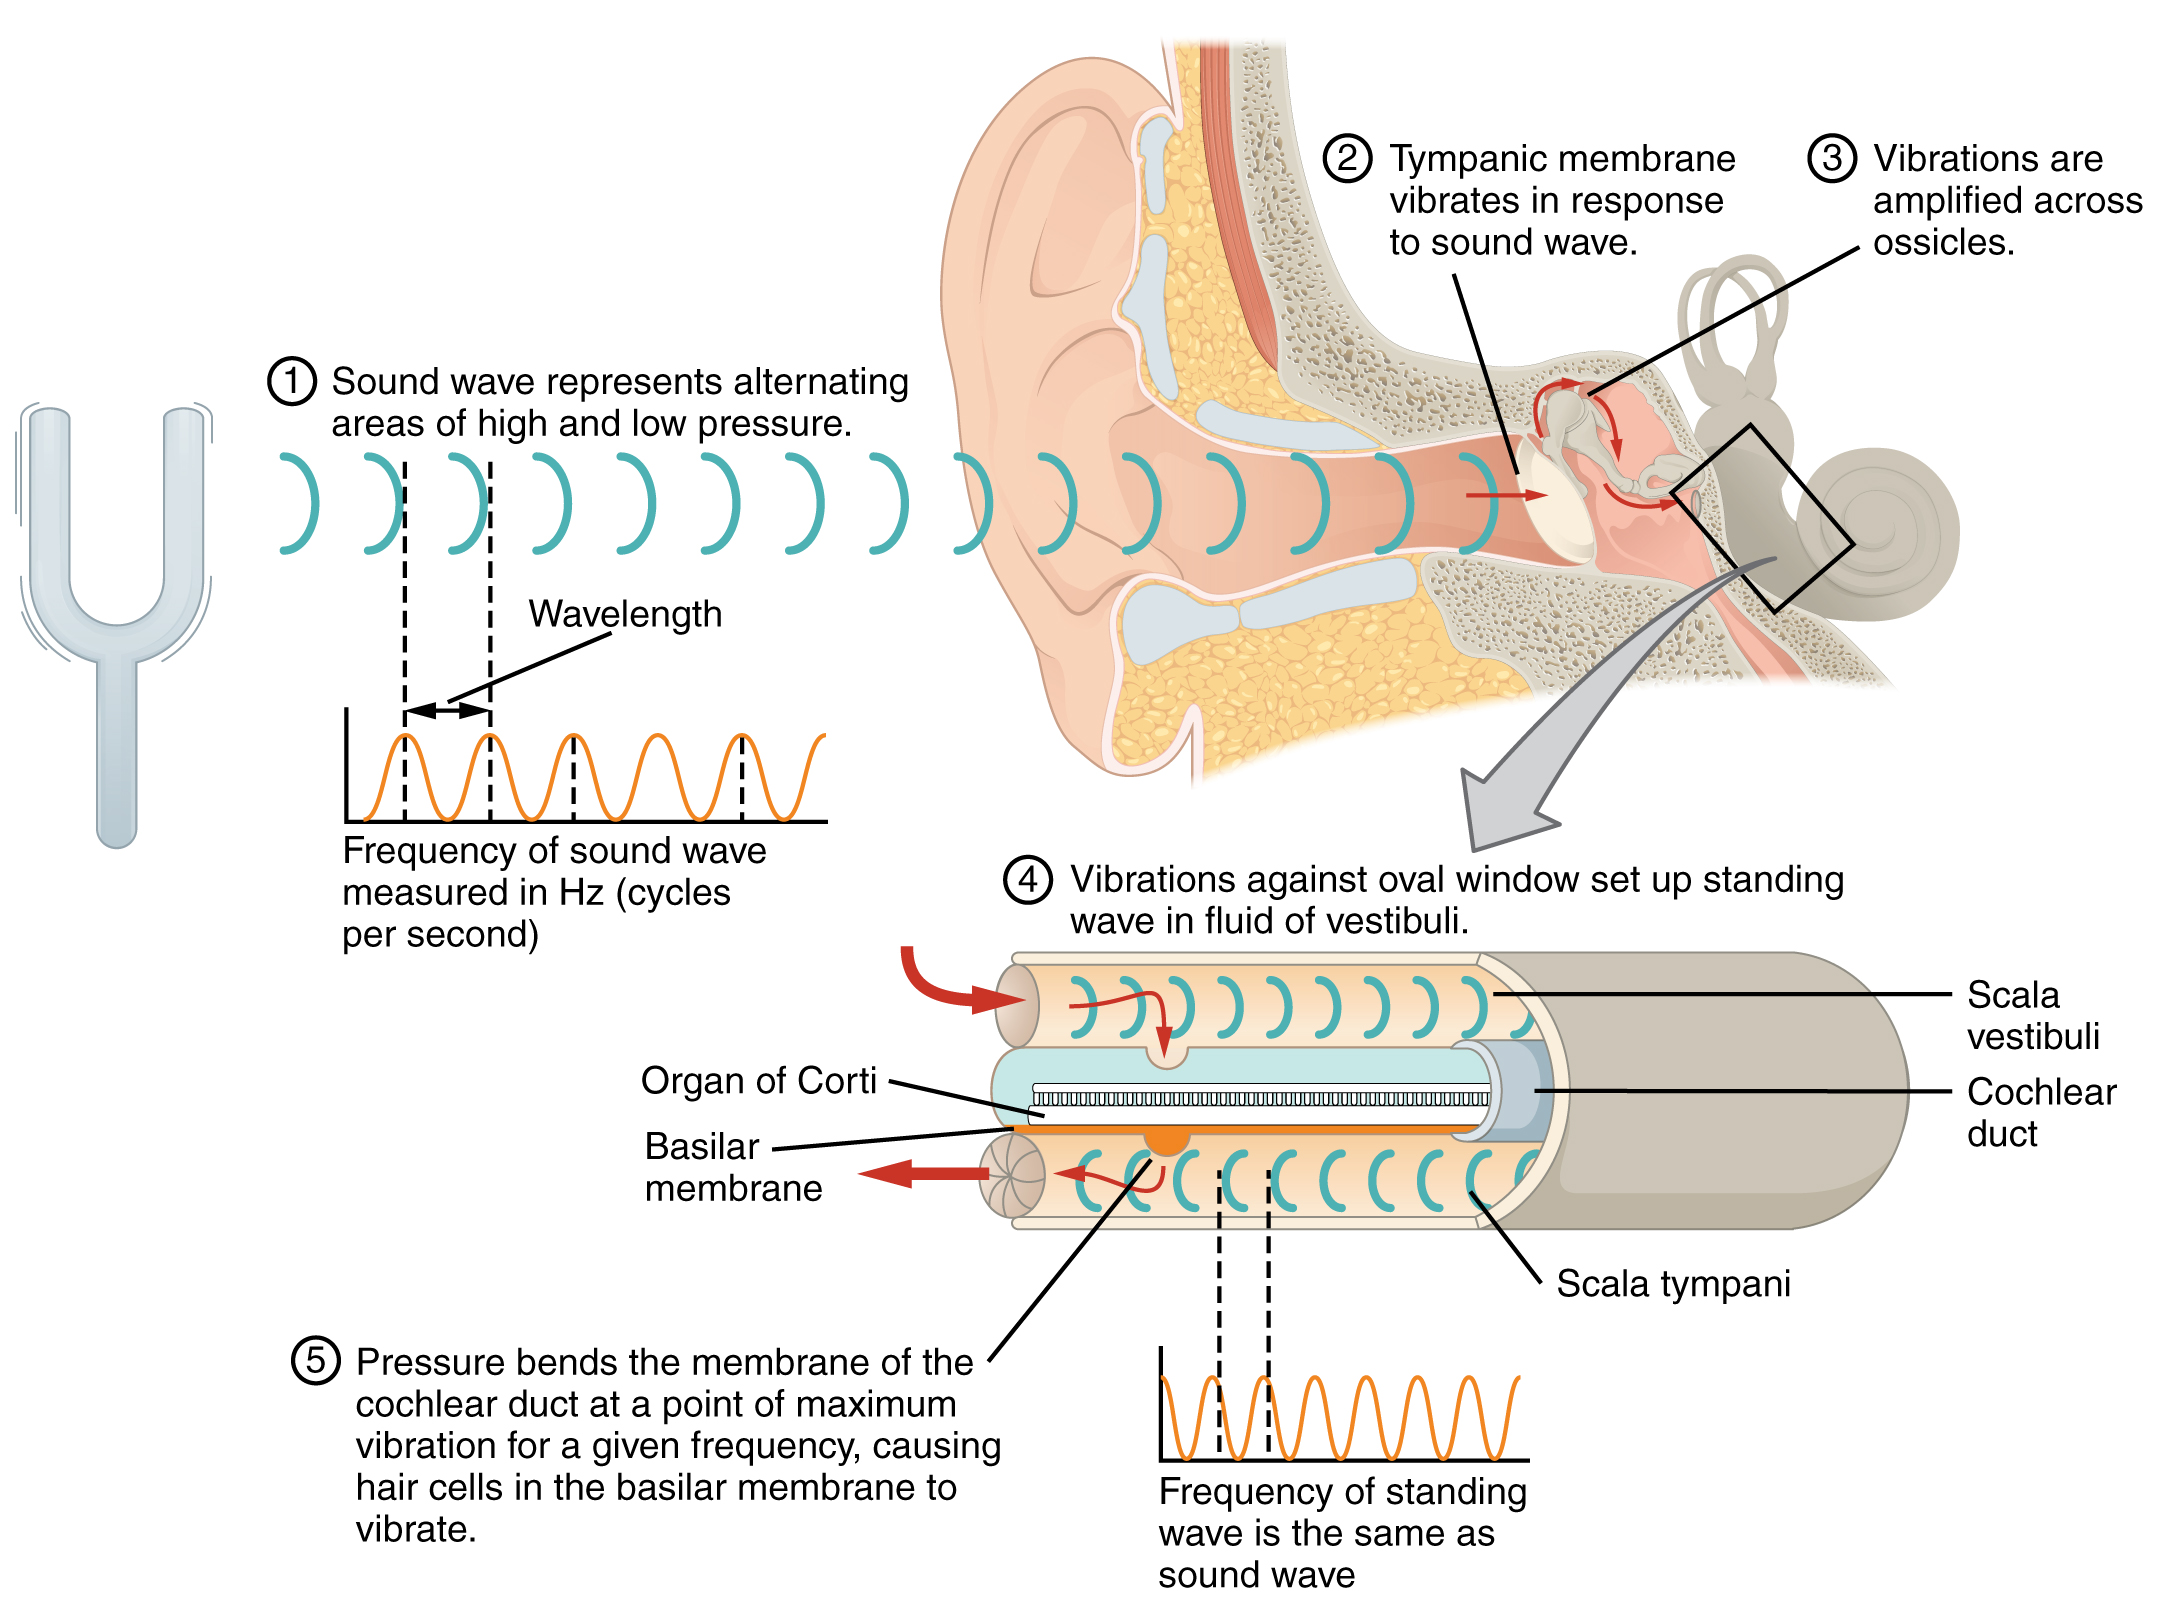
Figure 14.39 shows the middle and inner ear in greater detail. Pressure waves moving through the cochlea cause the tectorial membrane to vibrate, rubbing cilia (called hair cells), which stimulate nerves that send electrical signals to the brain. The membrane resonates at different positions for different frequencies, with high frequencies stimulating nerves at the near end and low frequencies at the far end. The complete operation of the cochlea is still not understood, but several mechanisms for sending information to the brain are known to be involved. For sounds below about 1000 Hz, the nerves send signals at the same frequency as the sound. For frequencies greater than about 1000 Hz, the nerves signal frequency by position. There is a structure to the cilia, and there are connections between nerve cells that perform signal processing before information is sent to the brain. Intensity information is partly indicated by the number of nerve signals and by volleys of signals. The brain processes the cochlear nerve signals to provide additional information such as source direction (based on time and intensity comparisons of sounds from both ears). Higher-level processing produces many nuances, such as music appreciation.
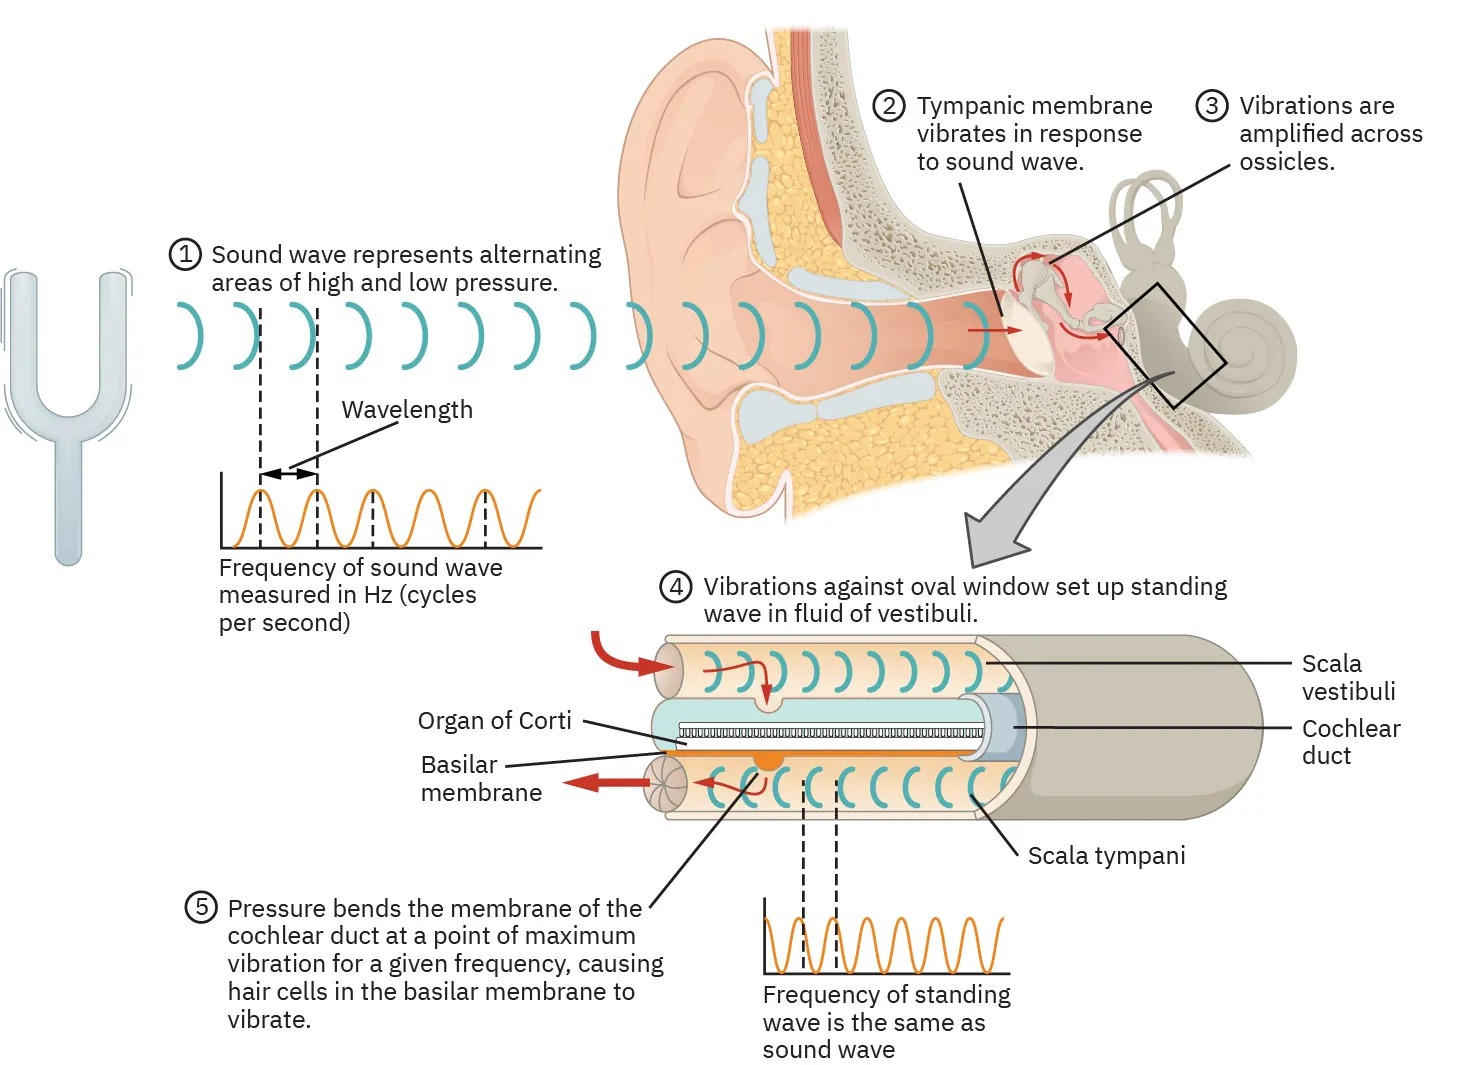
Image Description
This image illustrates the process of hearing through several labeled steps:
- A sound wave, shown as alternating areas of high and low pressure, approaches the ear. The accompanying graph shows the frequency of the sound wave measured in Hz (cycles per second), identifying the wavelength.
- The tympanic membrane (eardrum) vibrates in response to the incoming sound wave.
- The vibrations from the tympanic membrane are amplified as they pass across the ossicles (tiny bones in the middle ear).
- These vibrations against the oval window create a standing wave in the fluid of the vestibuli, a part of the inner ear.
- The pressure bends the membrane of the cochlear duct at a point of maximum vibration for a given frequency. This causes hair cells in the basilar membrane to vibrate. The frequency of the standing wave is the same as the original sound wave.
Labels on the diagram indicate specific parts of the ear involved in this process: the scala vestibuli, cochlear duct, organ of Corti, basilar membrane, and scala tympani.
Hearing losses can occur because of problems in the middle or inner ear. Conductive losses in the middle ear can be partially overcome by sending sound vibrations to the cochlea through the skull. Hearing aids for this purpose usually press against the bone behind the ear, rather than simply amplifying the sound sent into the ear canal as many hearing aids do. Damage to the nerves in the cochlea is not repairable, but amplification can partially compensate. There is a risk that amplification will produce further damage. Another common failure in the cochlea is damage or loss of the cilia but with nerves remaining functional. Cochlear implants that stimulate the nerves directly are now available and widely accepted. Over 100,000 implants are in use, in about equal numbers of adults and children.
The cochlear implant was pioneered in Melbourne, Australia, by Graeme Clark in the 1970s for his deaf father. The implant consists of three external components and two internal components. The external components are a microphone for picking up sound and converting it into an electrical signal, a speech processor to select certain frequencies and a transmitter to transfer the signal to the internal components through electromagnetic induction. The internal components consist of a receiver/transmitter secured in the bone beneath the skin, which converts the signals into electric impulses and sends them through an internal cable to the cochlea and an array of about 24 electrodes wound through the cochlea. These electrodes in turn send the impulses directly into the brain. The electrodes basically emulate the cilia.
Check Your Understanding
Are ultrasound and infrasound imperceptible to all hearing organisms? Explain your answer.
Click for Solution
Solution
No, the range of perceptible sound is based in the range of human hearing. Many other organisms perceive either infrasound or ultrasound.
