Genetics Lab Outline
Introduction
Genomes have become one of the fastest growing scientific avenues of exploration in the last thirty years. Our ability to experimentally obtain genomic data, process said data and analyze genetic findings is largely due to the advancement of DNA sequencing technology and computing. Genome sequence information abounds for thousands of organisms; it is available at our fingertips through numerous online public databases. These genome sequences constitute huge amounts of data that require computational tools and software to sort and analyze the information. The field of bioinformatics combines many disciplines – computer science, statistics, molecular biology, among others – to gain biological insights through the analysis of biological data using computational methods.
For this lab we will explore various genome databases and bioinformatic tools in order to identify and study particular genes that play a role in healthy aging or lifespan. You will focus upon one gene from one model organism and explore the background information requested. Provide a citation and the web link (URL) for any acquired information when answering the questions. This will serve as your reference. These questions are the responses you'll be inputting to your ELN.
This lab will involve exploring and navigating databases and websites that are likely unfamiliar to you. Learning how to sift through these databases to find the information you need is part of the learning process. Don’t be afraid to search, explore, and ask questions as you answer the questions listed in the guide.
Each pair of students will be randomly assigned a model organism and candidate gene for completing the ELN upon arrival to lab. There is no advantage or disadvantage for any of the organisms or genes.
It is recommended that you use two web browser windows to proceed through this lab - one for the Pressbook instructions, and one for using the databases and bioinformatics tools.
Gene nomenclature (i.e. conventions or rules for naming genes) are pretty specific. Genes are named in a variety of ways, and there are specific conventions applied to each organism. Here are some resources on gene nomenclature for the model organisms listed in table I. These can help you make sense of the letters, symbols, numbers, use of capital letters etc., and what they mean.
Lab Overview and Timeline
Lab Part 1: Age-related Gene Effects in Model Organisms
Purpose
To use a model organism database to research your gene of interest and the model organism, and answer the associated Lab Part 1 Questions. Refer to the gene assignment slide on the projector to see which model organism and gene of interest you have been assigned.
Summary of Activities
Your task is to explore the database specific to the model organism that you are studying. These model organism databases are particularly useful for finding the most recent information about the genes and their products in that model organism. Be aware that it may require navigating through a few pages. You may also look to the research literature provided as links on these websites, so long as you properly cite them in your assignment.
Materials
- Computer and internet access (there are 16 available computers for use in the lab, each pair will work on one of the provided devices)
Lab Protocol 1: Using Model Organism Databases
- Open the model organism database for your assigned model organism/gene of interest from the slide show shown by the TA.
- In the database for your model organism, type the name of your assigned gene into the search box and click search.
- For the nematode database, make sure 'gene' is selected from the dropdown menu next to the search box
- For the fruit fly database, make sure 'J2G' (jump to gene) is selected.
- For the mouse and and yeast databases, there is no dropdown menu so just click search.
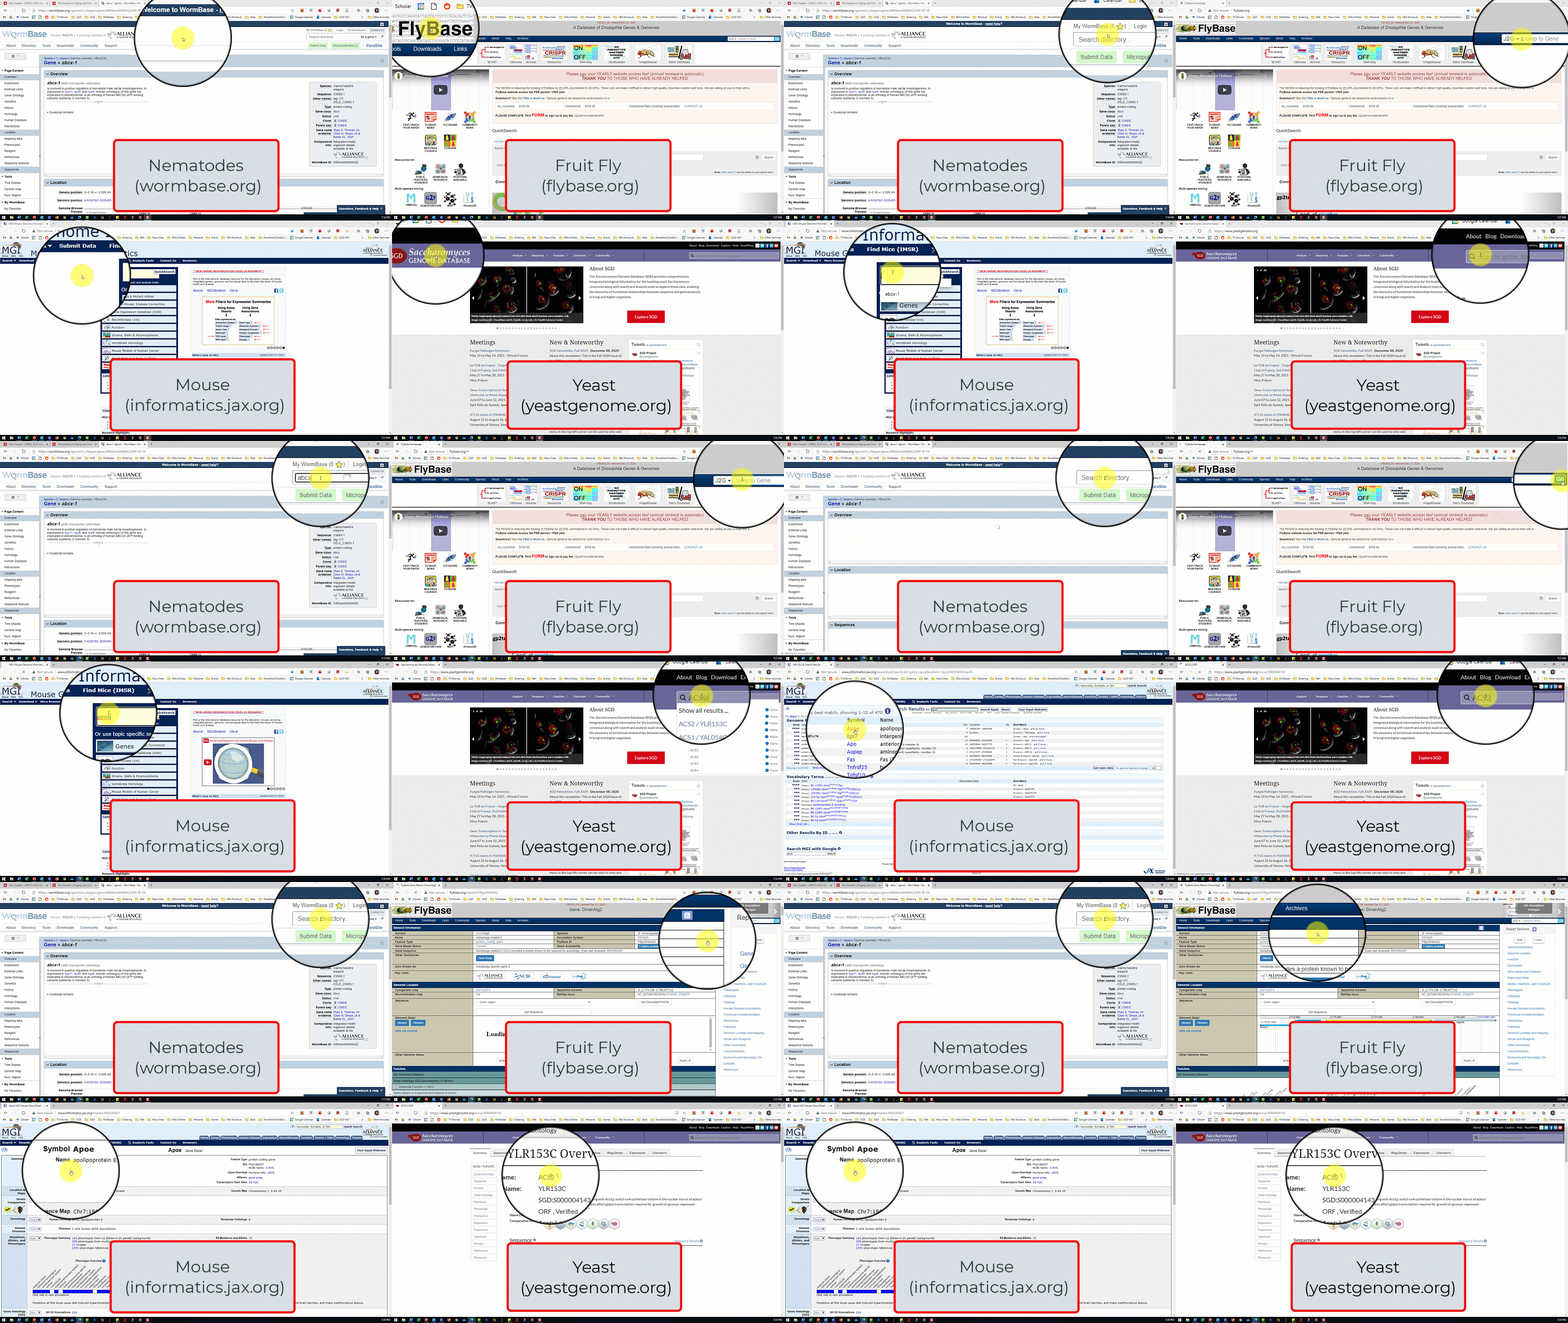
- Use the search results to answer the lab part 1 questions.
- You may also need to find additional sources (e.g. review articles on your model organism, research websites for your model organism etc.) to answer these questions. One resource that may be helpful to you is the GenAge website, which summarizes genes, identified in model organisms, that can influence the aging process.
Lab Part 1 Questions
Reminder: Provide a web link for any acquired information instead of citation and reference list. This is to save you time in completing the ELN.
e.g. The nematode is a type of roundworm (https://www.britannica.com/animal/nematode).
1A. What is the name of the gene you are studying?
1B. What is the function of your gene (biochemical activity of the protein in the model organism?) Be sure to cite a resource you used to answer this question.
1C. Is the gene pro- or anti-longevity? Provide the citation for one scientific research paper that describes this effect.
1D. What is the typical lifespan of this organism? Why is it useful to study aging in this system?
Lab Part 2: Exploring Genome Context
Purpose
To investigate the physical context of your gene of interest using the National Center for Biotechnology Information (NCBI) Gene database, and answer the associated Lab Part 2 Questions.
Summary of Activities
Search for your gene on 'NCBI – gene database'. Once you find your gene entry, look under the ‘genomic context’ section for your gene and answer the associated questions (lab part 2 questions).
Materials
- Computer and internet access
Lab Protocol 2: Finding Your Gene Entry on the 'NCBI - Gene Database'
In recent years, genetic databases have grown to include information beyond just the sequence of the gene. This information includes:
- the physical location of the gene on the chromosome on which it is encoded (referred to as the gene locus)
- visual representation of the gene on the chromosome and surrounding area
- gene expression information
- protein sequence, structure and function
- references to scientific literature that describes what is known about the gene and its role in an organism.
While many of the model organism databases provide some of this information, the NCBI is the most comprehensive across all databases available and offers many different bioinformatics resources and tools. Find your gene of interest on the 'NCBI - gene database'.
Lab Protocol 2: Searching Directly For Your Gene on the 'NCBI - Gene Database'
- Open the NCBI database
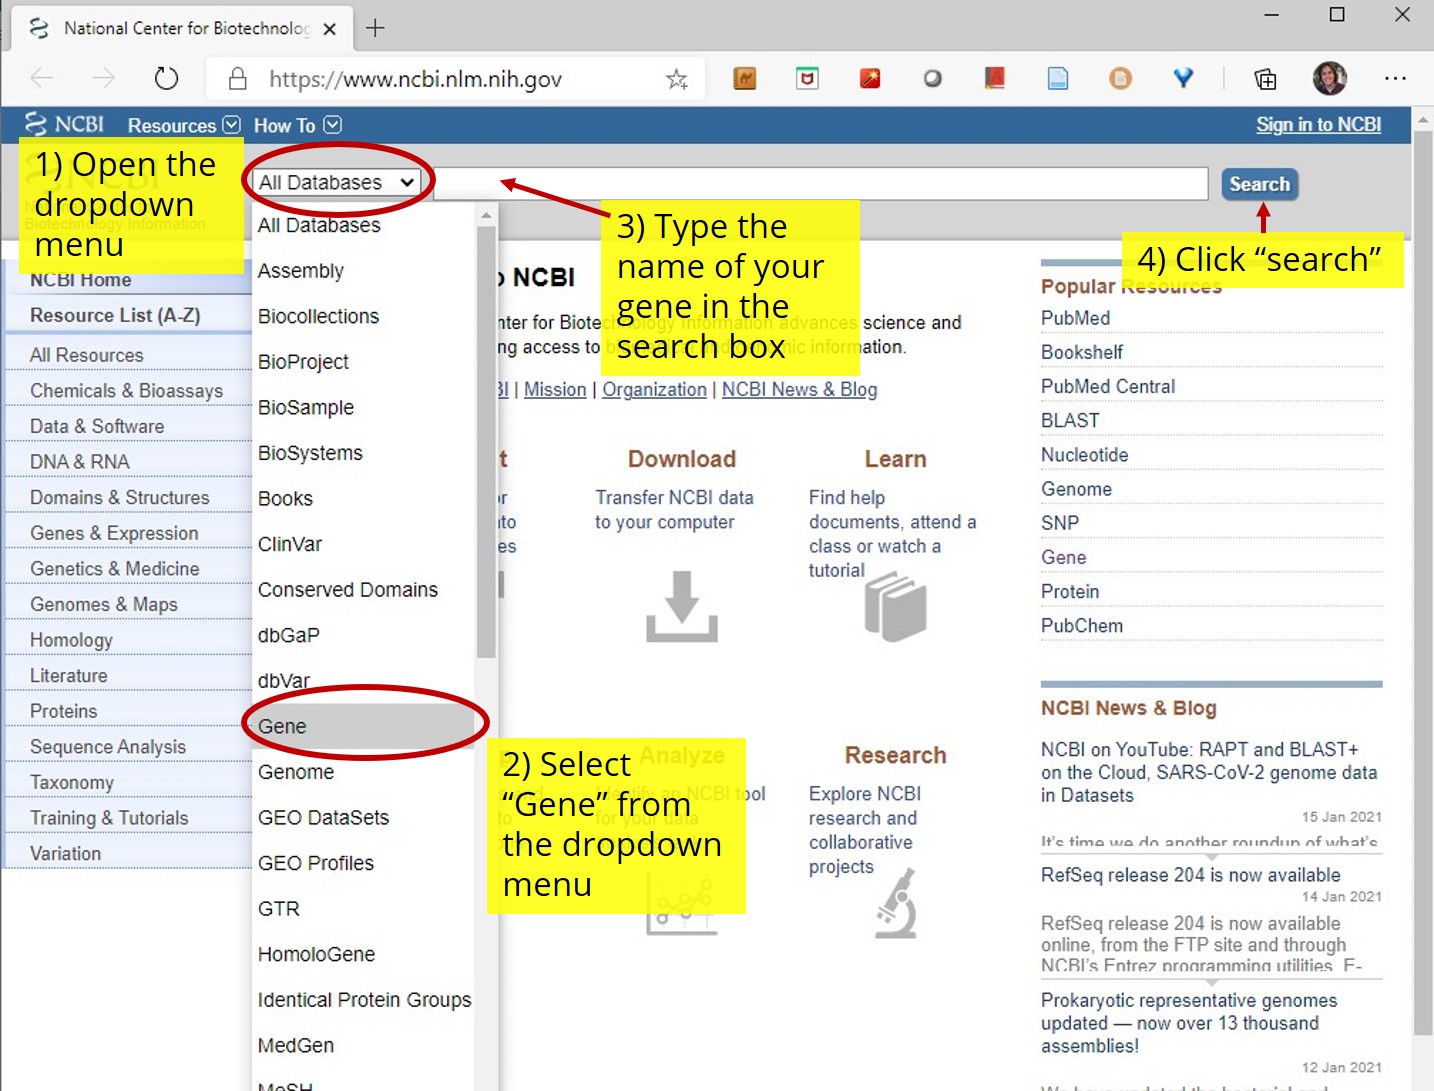
- Select "gene" from the dropdown menu in the search box. Type the name of your assigned gene in the search box and click search (see figure 2).
- NCBI will search it's gene database and display all the results (i.e. gene entries) that may be related to your search query (see figure 3). For example, if the gene name you searched is contained within the description of another gene entry, it will be included as a search result. There may also be multiple search results for the same model organism.
-
- You will need to carefully read the gene name/ID and descriptions and select the entry that corresponds to your gene of interest and model organism.
- You may need to Google the different scientific names listed under the description in order to identify which result corresponds to the model organism you were assigned.
Figure 3: Search result screen from an 'NCBI - gene database' search. The search query (in this case, "daf-16") will generate a list of results (i.e. gene entries) that may be related to the search query. Click the crosshair icon in the image for more information.
-
- Once you identify the result that corresponds to your gene of interest and model organism, click the name of the gene from under the 'Name/Gene ID' column to open up your gene entry on the NCBI database.
Lab Protocol 3: Researching your Gene On The 'NCBI - Gene Database'
- There are a number of sections that provide information about the gene on the NCBI Gene entry page. Navigate to the bibliography section to see research papers for your gene of interest.
- Navigate to the “Genome Context” section.
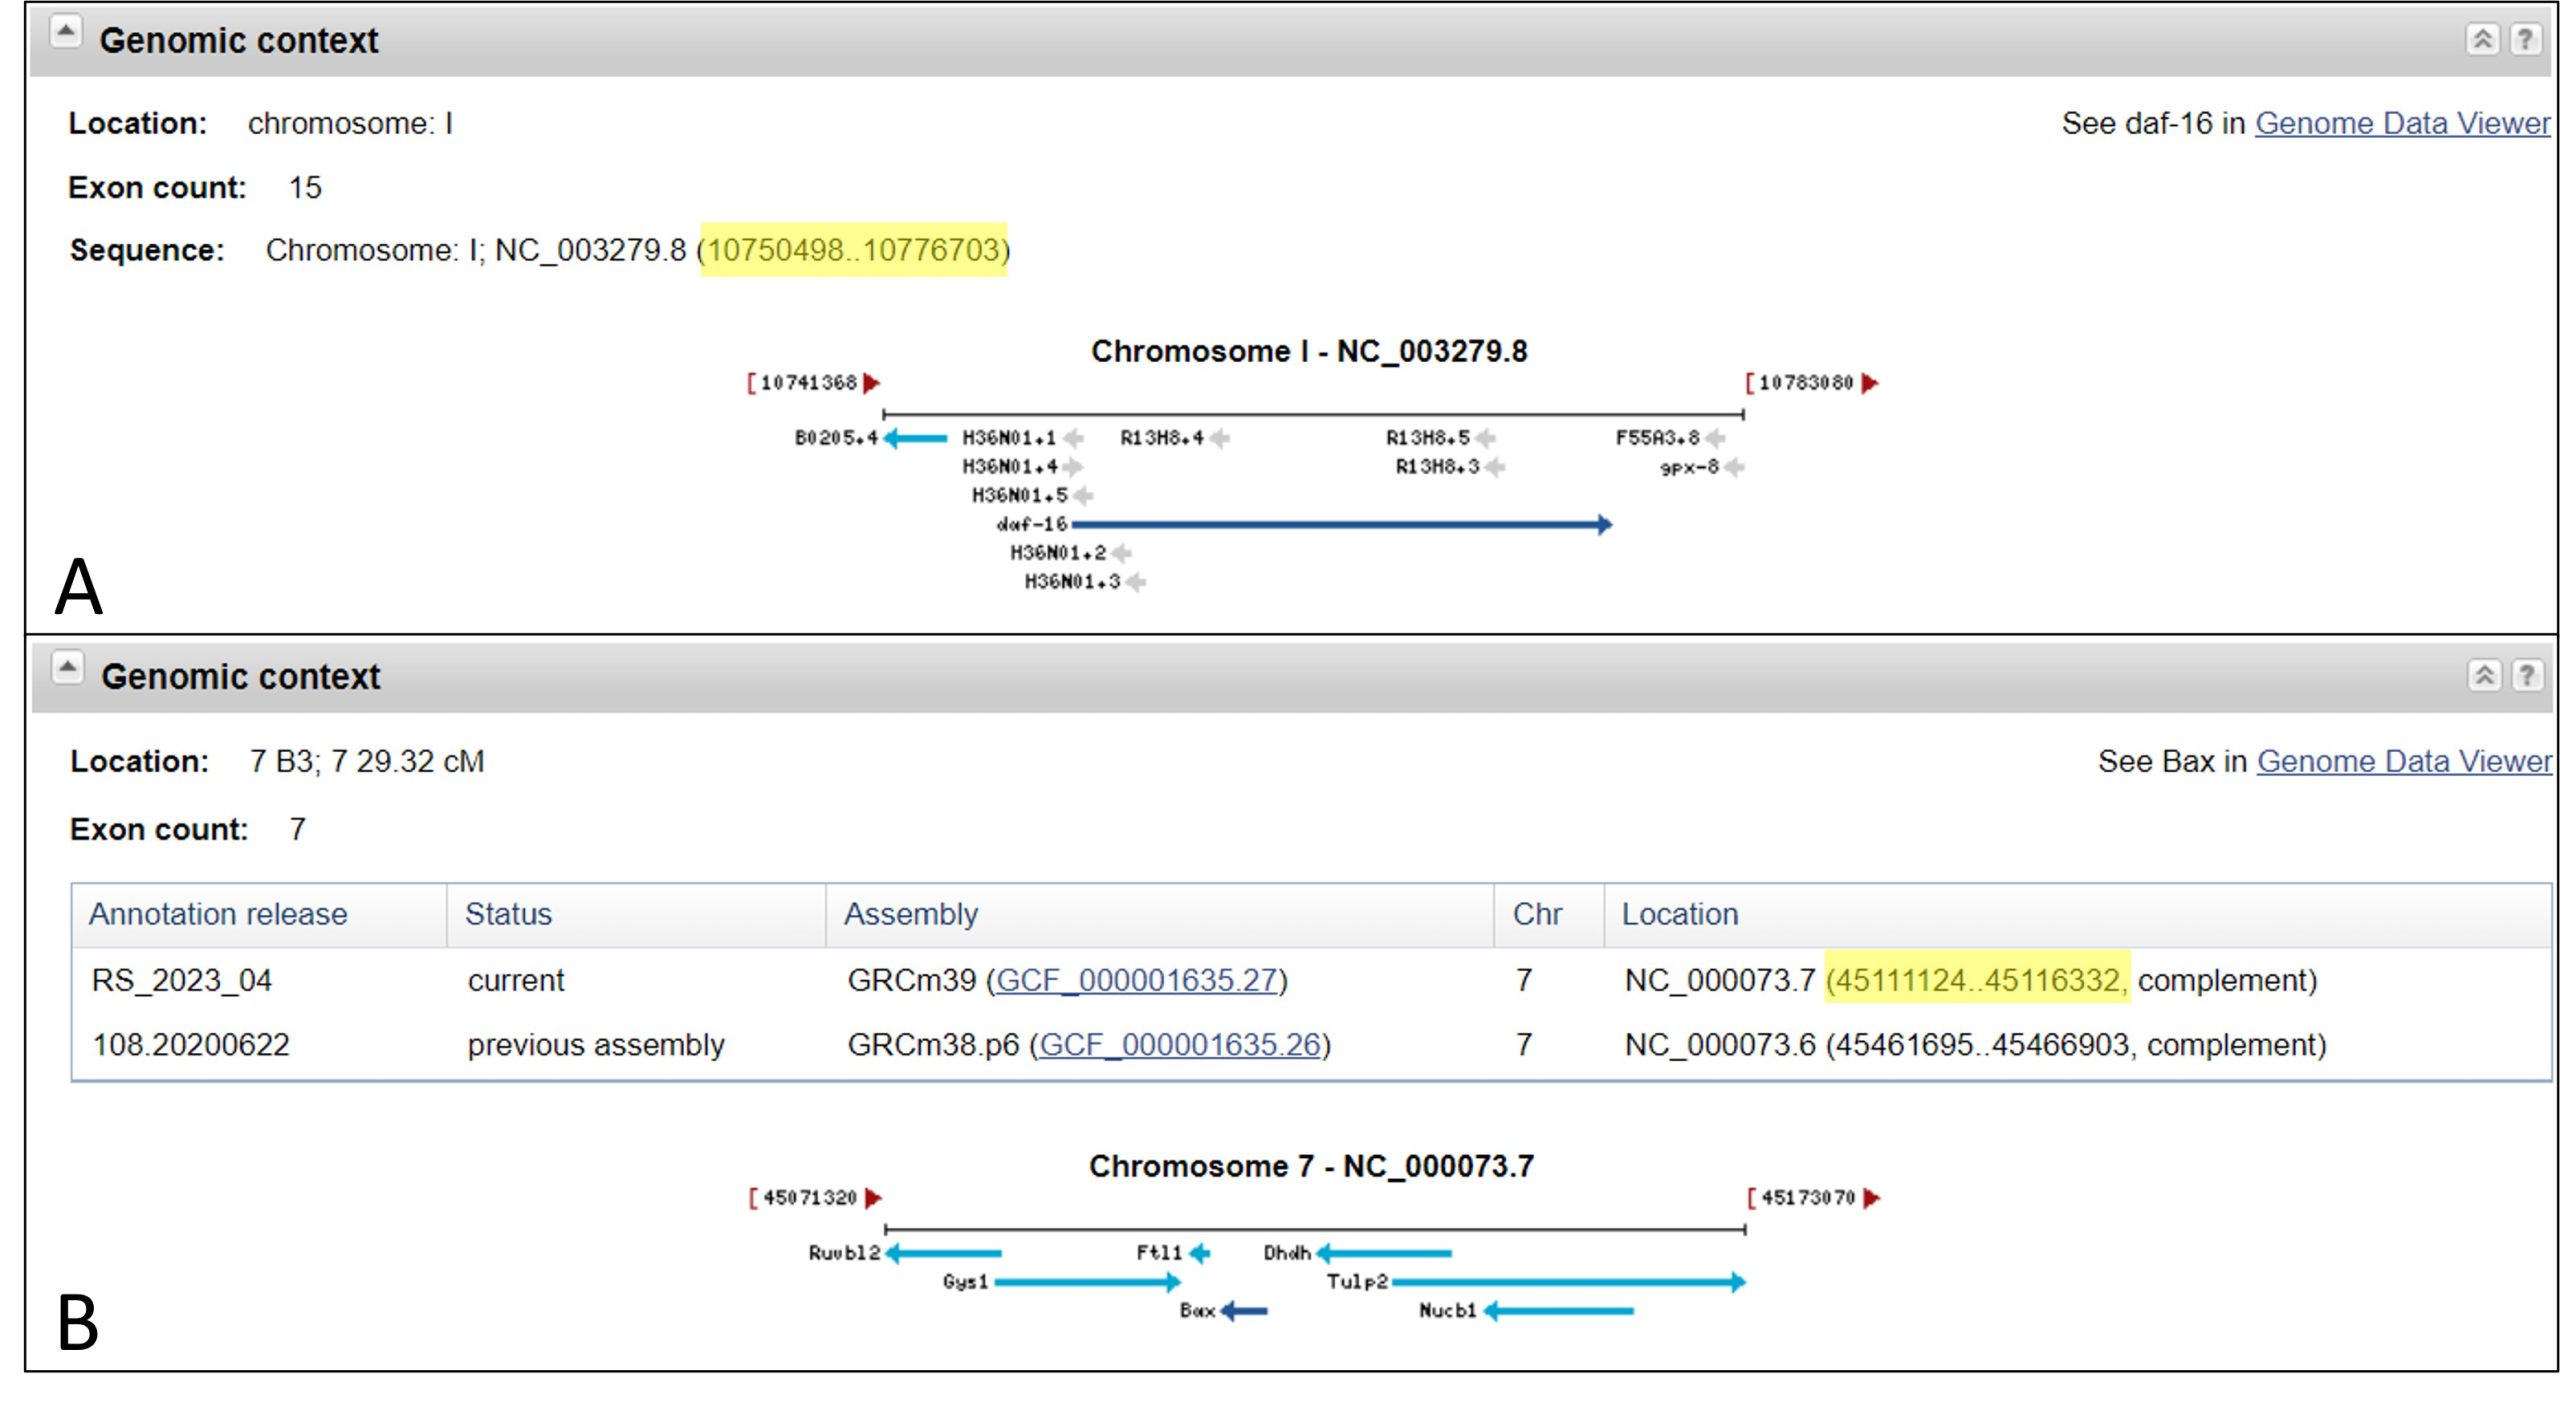
- This section will show a visual representation of your gene of interest and the genes surrounding it on the chromosome.
- As you recall, DNA is double stranded, where one strand is referred to as the forward strand and the complementary strand is referred to as the reverse strand. Genes can be encoded on either strand.
- In diagrams, genes are conventionally represented as arrows, where an arrow pointing right (→) represents a gene encoded on the forward strand, while a left-facing arrow (←) represents a gene encoded on the reverse strand.
- Adjacent genes are described as being upstream or downstream, where upstream refers to a gene that precedes the gene of interest, while downstream is located after the gene.
- Refer to figure 5 for additional information about the 'Genome Context' section.
- Answer the lab part 2 questions.
Lab Part 2 Questions
Reminder: Provide a web link for any acquired information instead of citation and reference list. This is to save you time in completing the ELN.
2A. Which chromosome is your gene of interest encoded on?
2B. What is the base range of the gene (i.e. where exactly is it located?)
2C. Which strand is your gene of interest encoded on?
2D. What is/are the gene name(s) for the genes upstream and downstream of your gene? Be sure to indicate which is upstream and which is downstream.
2E. What is the total number of chromosomes for your model organism? (You may have to find this information from another source).
2F. Take a screen capture of your gene of interest as depicted in the Genomic Context section (see example in figure 4) and upload it onto Crowdmark.
Lab Part 3: Identifying Homologous Sequences
Purpose
To find the protein sequence of your gene of interest and identify homologous sequences in other animal species using a Basic Local Alignment Search Tool (BLAST), and answer the associated Lab Part 3 Questions.
Summary of Activities
Follow lab protocol 4 to find the protein sequence for your gene. You want to find the sequence in FASTA format. You can find your protein sequence multiple ways.
Once you find the protein sequence for your gene of interest, follow lab protocol 5 to use a Basic Local Alignment Search Tool (called BLAST) to find the best “hits” for the protein sequence matches in humans plus 4 different animal taxa (e.g. mouse, fruit fly, baker’s yeast, round worm). You are identifying similar sequences through this alignment and making the assumption that they are homologous due to a shared common ancestry. When similarity in gene (or protein) sequences from two different species is a result of a common genetic ancestor, those genes (or proteins) are said to be homologous, or are called homologs.
Materials
- Computer with internet access
Lab Protocol 4: Obtaining The Protein Sequence for Your Gene of Interest
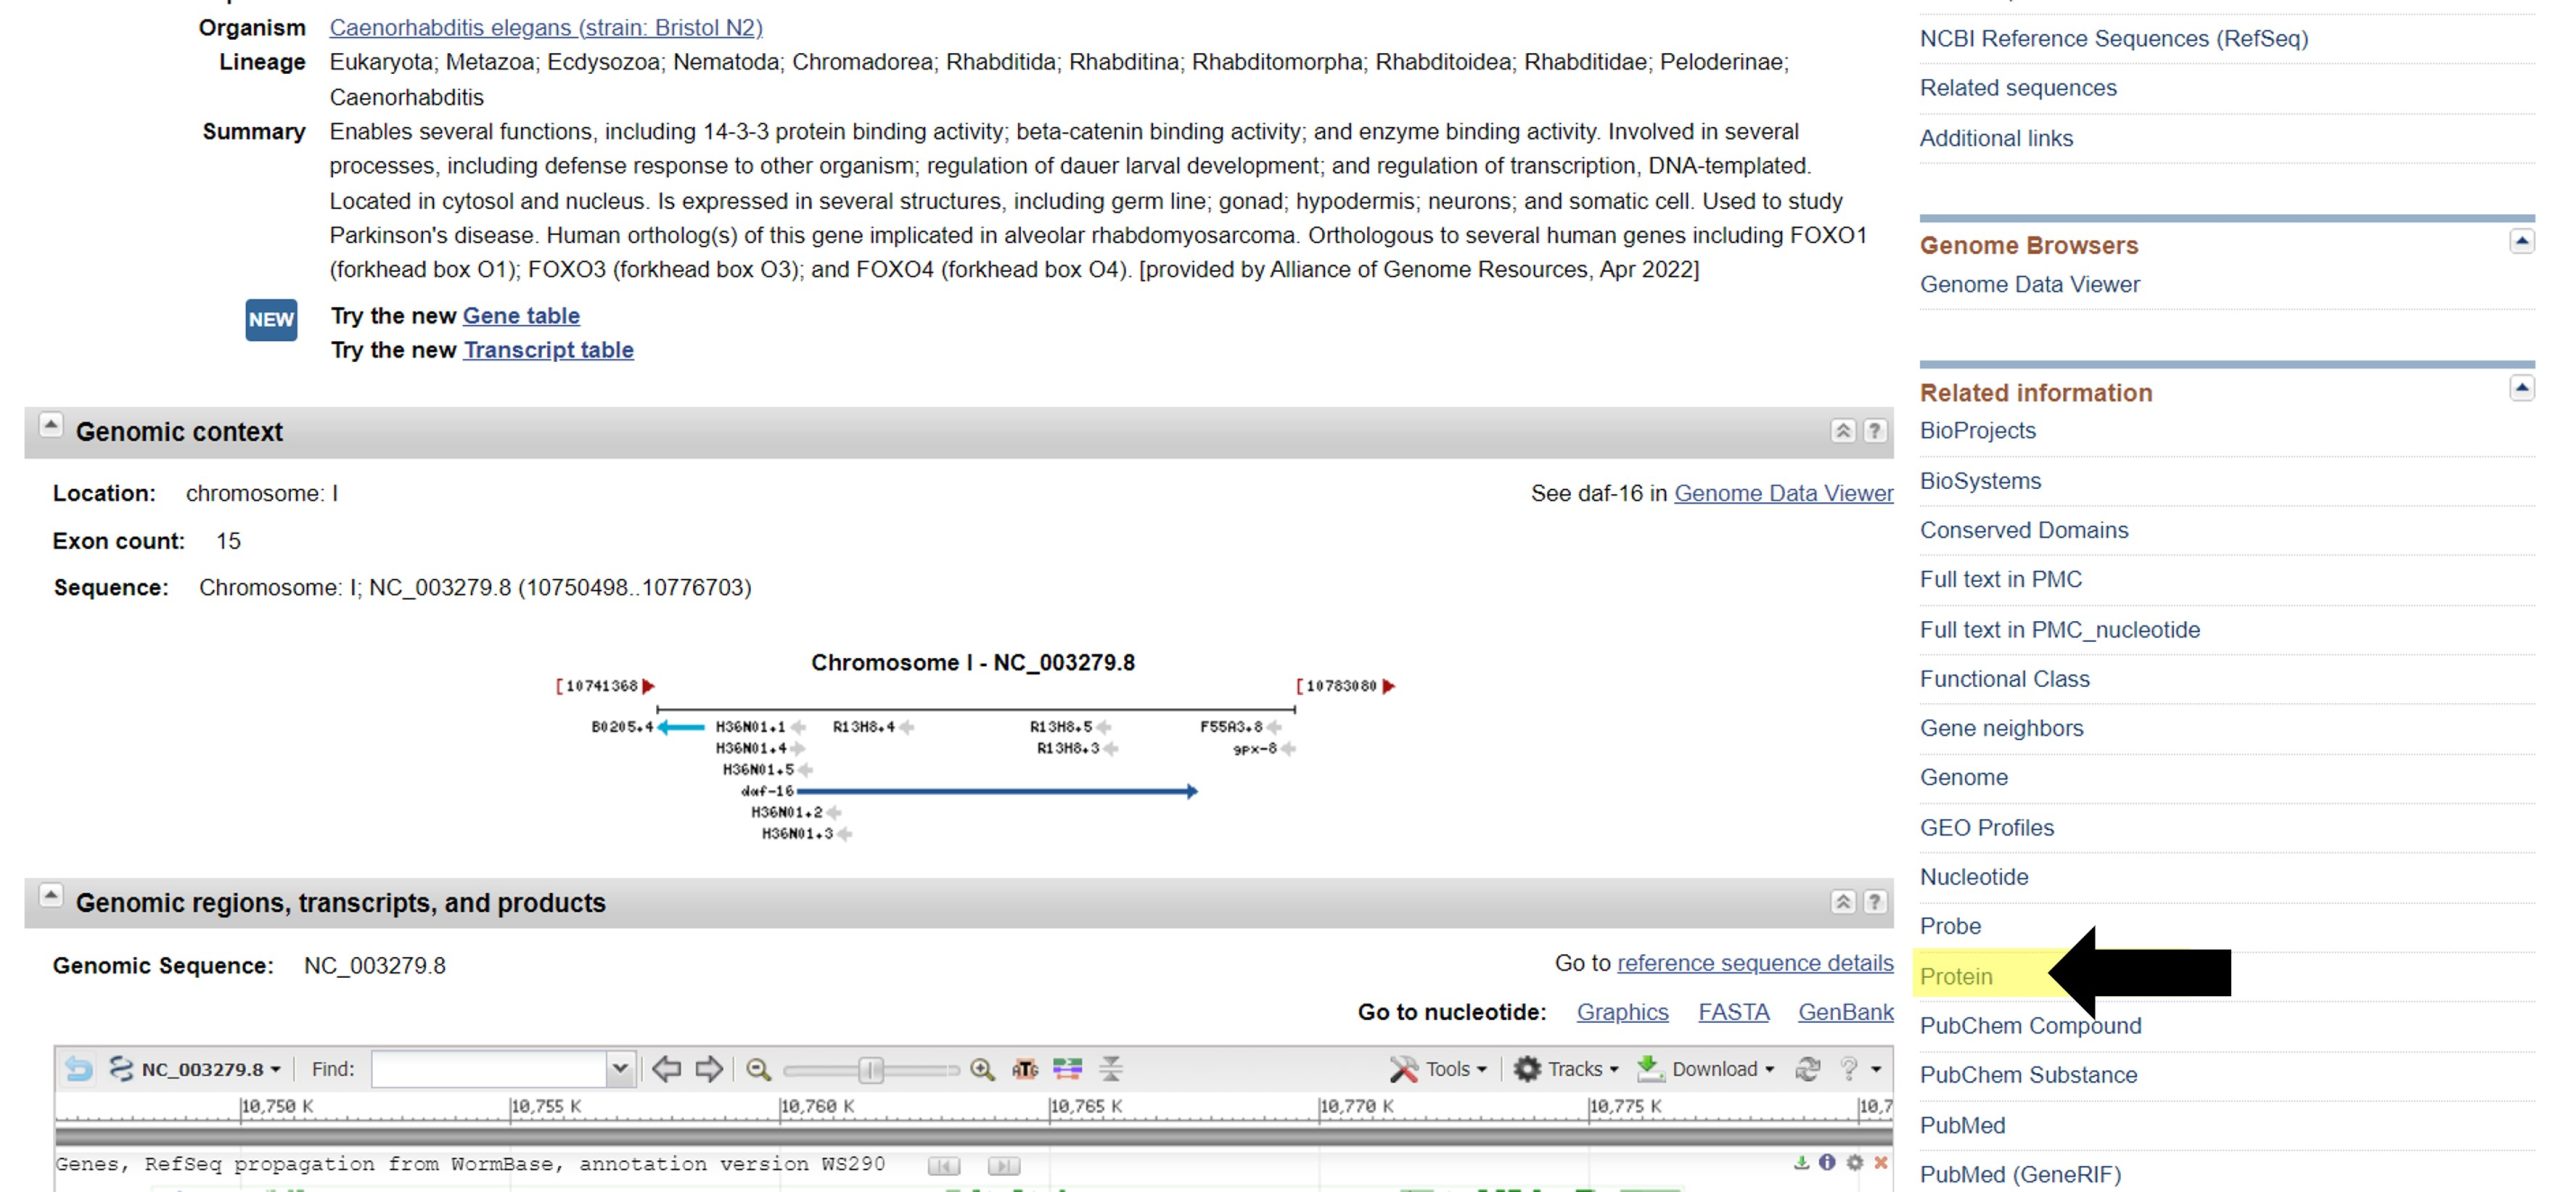
- Obtain the protein sequence for your gene of interest. There are multiple ways to find the protein sequence. The most straightforward way is to navigate to it from the NCBI Gene page you were just on by selecting "Protein" in the right-hand menu under "Related information" (highlighted in yellow, black arrow):
Another way to find the protein sequence includes searching for the protein sequence directly on the 'NCBI - protein database', as described below:
-
-
- Follow the steps in figure 2, but select the "Protein" database from the dropdown menu instead of the "Gene" databaseThere may be more than one protein sequence available for your gene, for example, if there are multiple isoforms of the protein. Generally, you will choose the translation of the first coding transcript that is in the list. Make sure that you have the amino acid sequence and not the mRNA or DNA sequence!
-
2. You will need a copy of your protein sequence in FASTA format (see description below) for later, in lab part 4. To do this, once you have found your protein sequence in NCBI Protein, click on the "FASTA" hyperlink just below the title of the protein.
What is FASTA format?
Modified from the National Center for Biotechnology Information (NCBI, n.d.)
A sequence in FASTA format begins with a single-line description, followed by lines of sequence data. In the sequence data, amino acids are represented using single-letter codes. Table III defines which amino acid is represented by each letter.
Here is an example protein sequence in FASTA format. Highlighting has been added for clarity:

The description line (or defline, highlighted in yellow) is distinguished from the sequence data (highlighted in red) by a greater-than (">") symbol at the beginning . It is recommended that all lines of text be shorter than 80 characters in length. In this sequence, the first 3 amino acids in this protein (Q - I - K) would be glutamine - isoleucine - lysine.
Table II: Amino acid codes used in the sequence data
| Letter | Amino Acid | Letter | Amino Acid | |
|---|---|---|---|---|
| A | alanine | P | proline | |
| B | aspartate/asparagine | Q | glutamine | |
| C | cystine | R | arginine | |
| D | aspartate | S | serine | |
| E | glutamate | T | threonine | |
| F | phenylalanine | U | selenocysteine | |
| G | glycine | V | valine | |
| H | histidine | W | tryptophan | |
| I | isoleucine | Y | tyrosine | |
| K | lysine | Z | glutamate/glutamine | |
| L | leucine | X | any | |
| M | methionine | |||
| N | asparagine |
Note: FASTA sequences use a monospaced font (e.g. Courier New), which means each letter is the same width. That way a line of sequence that is 70 letters long will always appear the same length on the page, no matter which specific letters are in the sequence line. This makes it easier to visually look at sequence alignments. This is what the first two lines of the example sequence above look like if a variable width font is selected (don't do this). Each line contains 70 letters:

3. Copy and paste the sequence, including the first line (">name of sequence") from the web browser into the Notepad app on your computer. You will need this later. Be sure there are no spaces in the amino acid sequence. It should look like this:

- Once you have the protein sequence for your gene of interest in FASTA format, proceed to lab protocol 5.
Lab Protocol 5: Identifying Homologous Sequences Using the Basic Local Alignment Search Tool (BLAST)
- From the NCBI Protein page or the FASTA protein sequence page, select "Run BLAST" from the "Analyze this sequence" section on the menu to the right.
- Alternatively, you can open the National Center for Biotechnology Information (NCBI) website and identify the Basic Local Alignment Search Tool (BLAST). See figure 6.
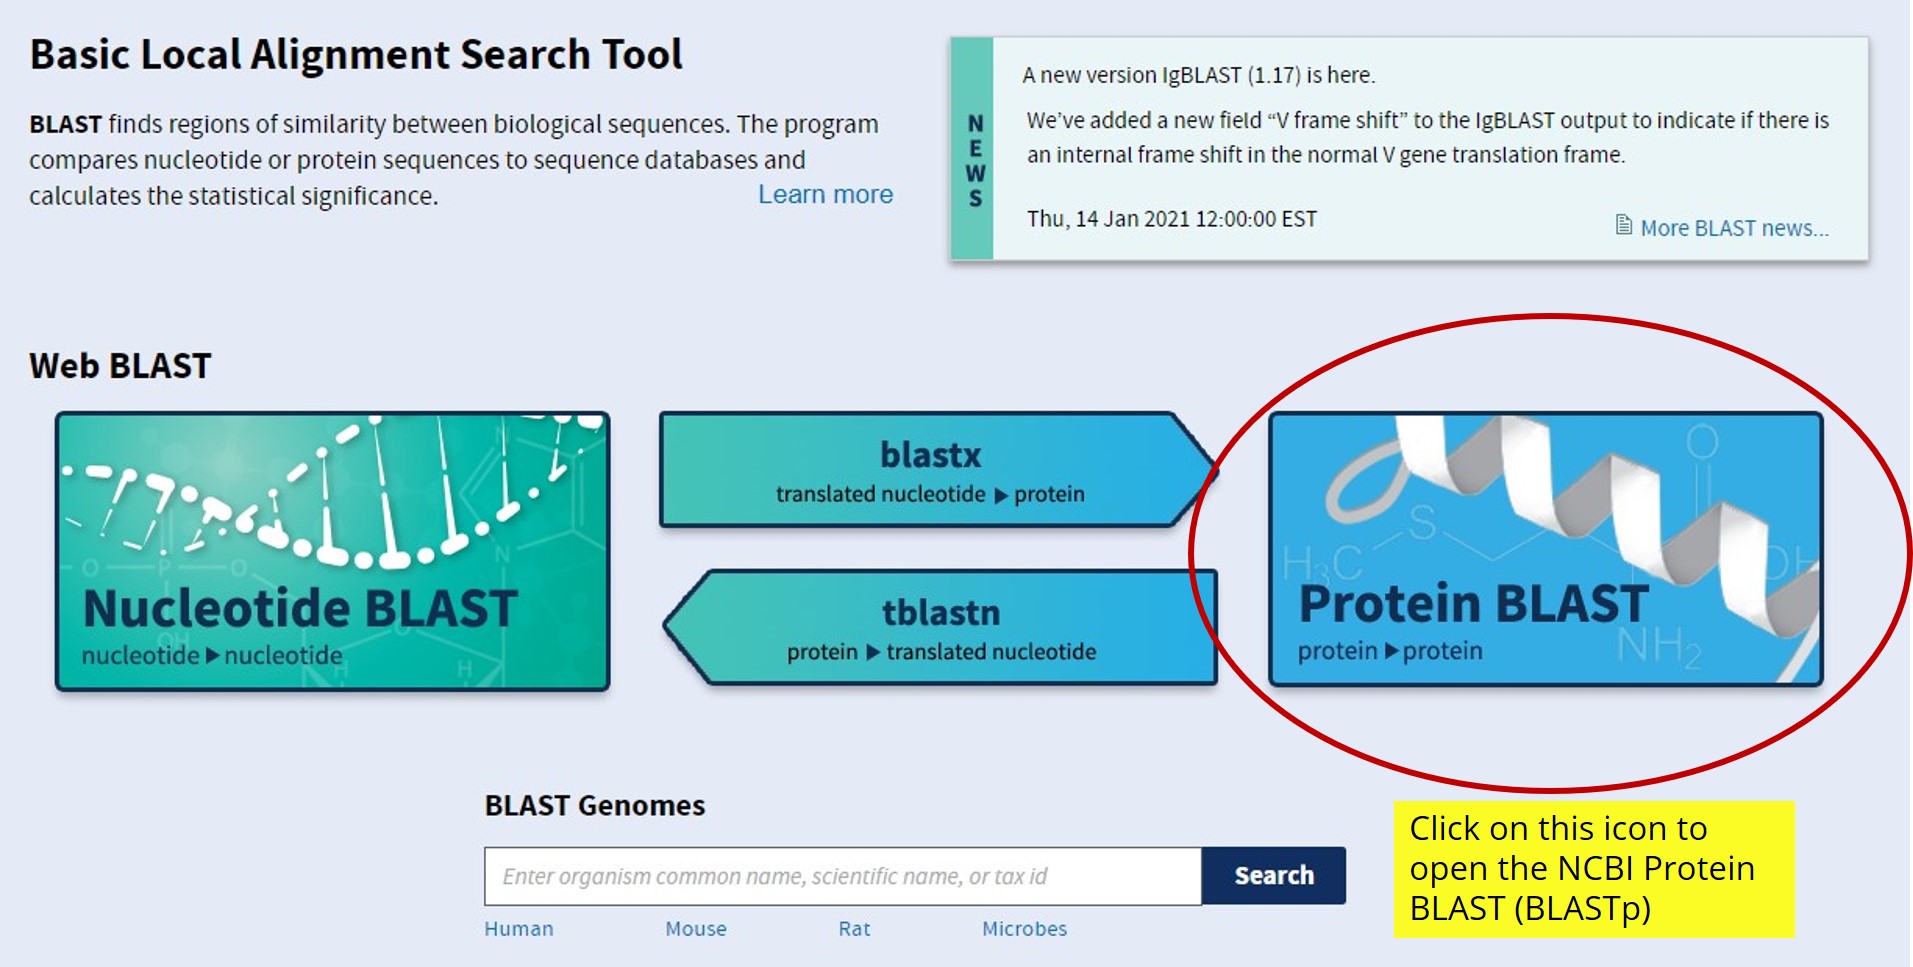
- We will be using the NCBI Protein BLAST (BLASTp) to identify homologous sequences in other organisms. BLASTp is a protein-to-protein comparison. By using the link from the NCBI Protein page, you will run a search using an accession number (already pre-loaded in the search box), but BLAST can also be run by copying and pasting your candidate gene’s protein sequence into the query sequence box, making sure the sequence is in FASTA format. Figure 7 shows how to set up the search for your protein sequence.
Figure 7: NCBI Protein BLAST (BLASTp) search directions. Click the crosshair icon in the image for more information.
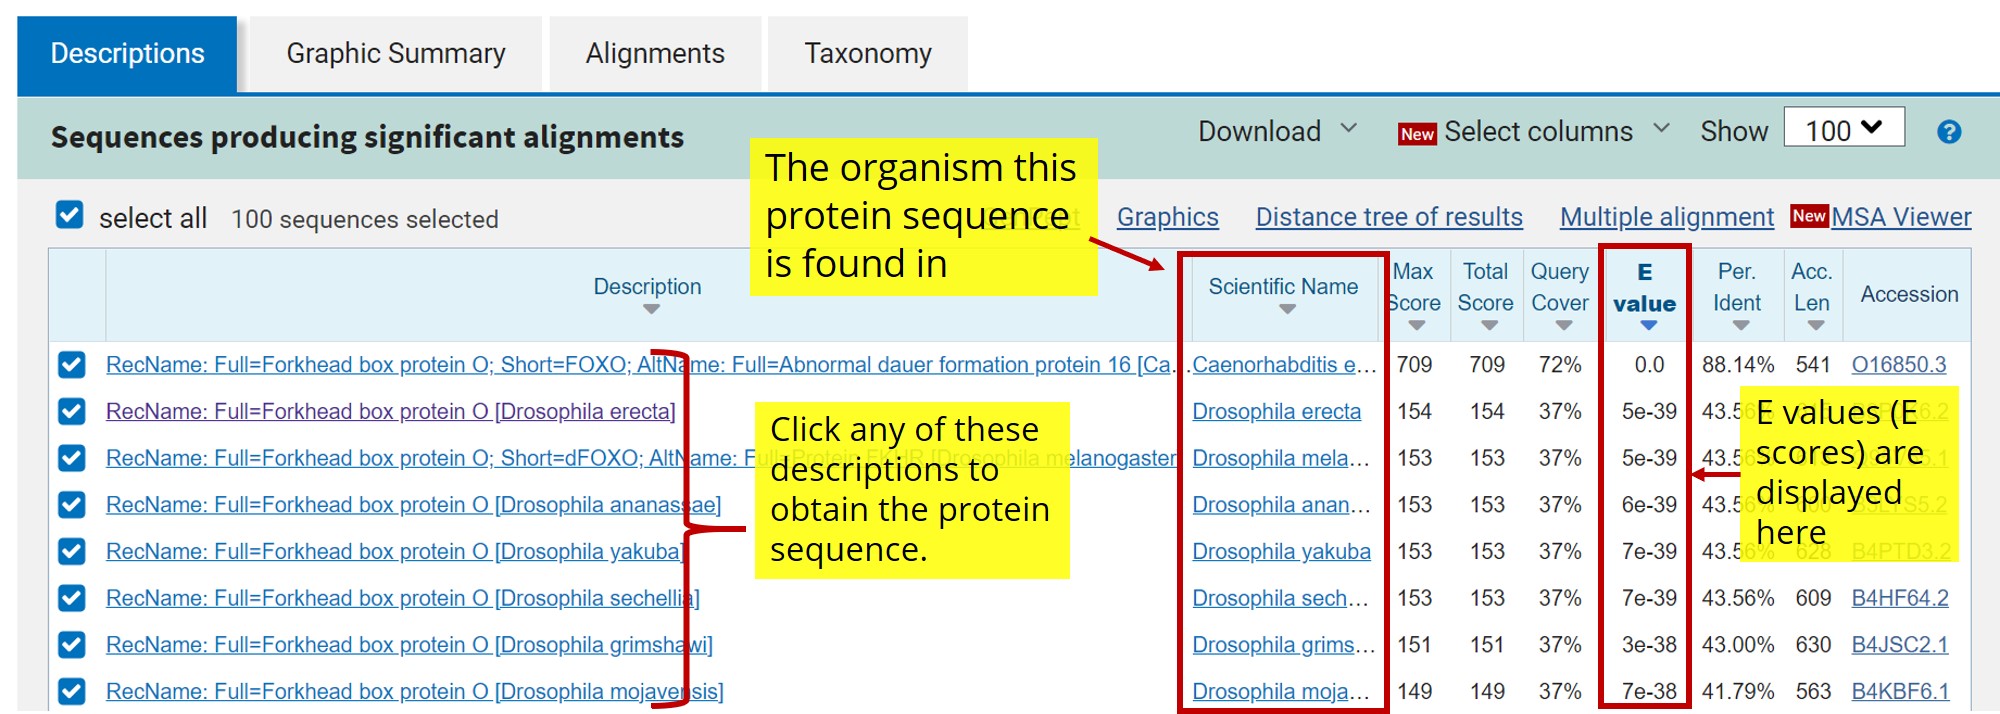
- When the search is complete, click on the description that is the “best hit” - the one with the lowest E value that does not belong to the model organism you were assigned. The E value is a representation of the significance of the match, and the lowest E value is the closest match (figure 8 - top image). Download the protein sequence from this match (see figure 8 - bottom image).
What do all these columns mean exactly?
E-value: “Expect” value; parameter that describes the number of hits one can "expect" to see by chance when searching a database of a particular size. It essentially describes the background noise of the data set. The lower the e-value (i.e. the closer to zero it is), the more significant the result is.
Score: the highest alignment score calculated from the sum of the rewards for matched nucleotides or amino acids and penalties for mismatches and gaps.
Percent Identity: The number of residues or bases that are identical as compared to the original sequence. Can also be defined as the extent to which two (nucleotide or amino acid) sequences have the same residues at the same positions in an alignment.
Figure 8: Top Image: NCBI Protein BLAST (BLASTp) search result screen. Bottom Image: After clicking one of the search results, you will be redirected to a new window where you can download the protein sequence. Click the crosshair icon in the image for more information.
- You will conduct this BLASTp search for humans plus three different animal taxa of your choice (e.g. mouse, fruit fly, yeast or nematode) to obtain a total of 4 homologous sequences. Collect and organize the 4 protein sequences into a single text file. You should already have a text file started (from lab protocol 4) which contains the protein sequence for your gene of interest - you can add these homologous sequences into the same file.
- Note: In total you will have 5 protein sequences. (The protein sequence for your gene of interest plus the 4 homologous sequences you found using the BLASTp search).
- Note: The gene may not be present in all organisms. In that case, you will need to search for it in different organisms than the ones we suggested.
- For each organism, list the protein sequences in your text file in the same format (i.e. FASTA format). Refer back to lab protocol 4 for a reminder on how to format the sequences in FASTA in Word, if needed. You will need these sequences for your alignment (completed in lab part 4).
Lab Part 3 Questions
REMINDER: Provide a web link for any acquired information instead of citation and reference list.
3A. List the protein sequence for your candidate gene plus the four other homologous protein sequences for each organism in FASTA format. Upload this to Crowdmark as a PDF.
3B. We are asking you to conduct a BLASTp search for this tutorial, but there is also an option to perform BLASTn search. BLASTn investigates DNA sequences (i.e. genes). What differences would you expect to see in terms of sequence conservation between DNA and protein sequences? (HINT: think about protein translation).
3C. Which homolog was most similar to your organism’s gene of interest?
Lab Part 4: Comparing Proteins Using Sequence Alignment
Purpose
To use Clustal Omega to construct a protein sequence alignment comparing the protein sequence from your gene of interest with the homologous protein sequences you identified from your BLASTp search, and to answer the associated Lab Part 4 Questions.
Summary of Activities
Conducting direct comparisons of gene or protein sequences allows scientists to discern changes that have occurred between species that can provide insight on the importance of specific regions in a gene or protein of interest. These comparisons are called sequence alignments. You will construct a sequence alignment to compare sequences from multiple organisms for your gene of interest.
There are many web-based tools that can be used to construct a sequence alignment to compare sequences from organisms. In this lab we will use Clustal Omega. This tool will allow you to enter multiple sequences and perform sequence alignments. Follow lab protocol 6 for directions on using Clustal Omega.
Materials
- Computer and internet access
Lab Protocol 6: Directions for Creating Sequence Alignments Using Clustal Omega
- Open Clustal Omega and follow the steps below (also described in figure 9) to construct a sequence alignment.
Figure 9: Directions for creating a sequence alignment in Clustal Omega (lab protocol 6). Click the crosshair icons in the image for more information.
- Under "Sequence type" select PROTEIN from the button options.
- Under "Paste your sequence here" enter your protein sequences from each organism (you should have 5 total) into the sequences box.
- Note again that you must use FASTA formatting for all your input sequences. In FASTA formatting, you must designate a name for each sequence (preceded by a “>”), followed by the sequence on the next line. Refer back to lab protocol 4 for a reminder on FASTA formatting
- Make sure to include the name of the organism the sequence belongs to when you designate the name for each sequence.
- If you have already formatted all the sequences in FASTA format within a Word document, you can simply copy all the sequences from that document into the sequences box on Clustal Omega.
- Under "Output Format" select "ClustalW with character counts" from the dropdown menu.
- This will make it easier to identify the exact location of highly conserved amino acids.
- Enter a title in the textbox, then click the "Submit" icon
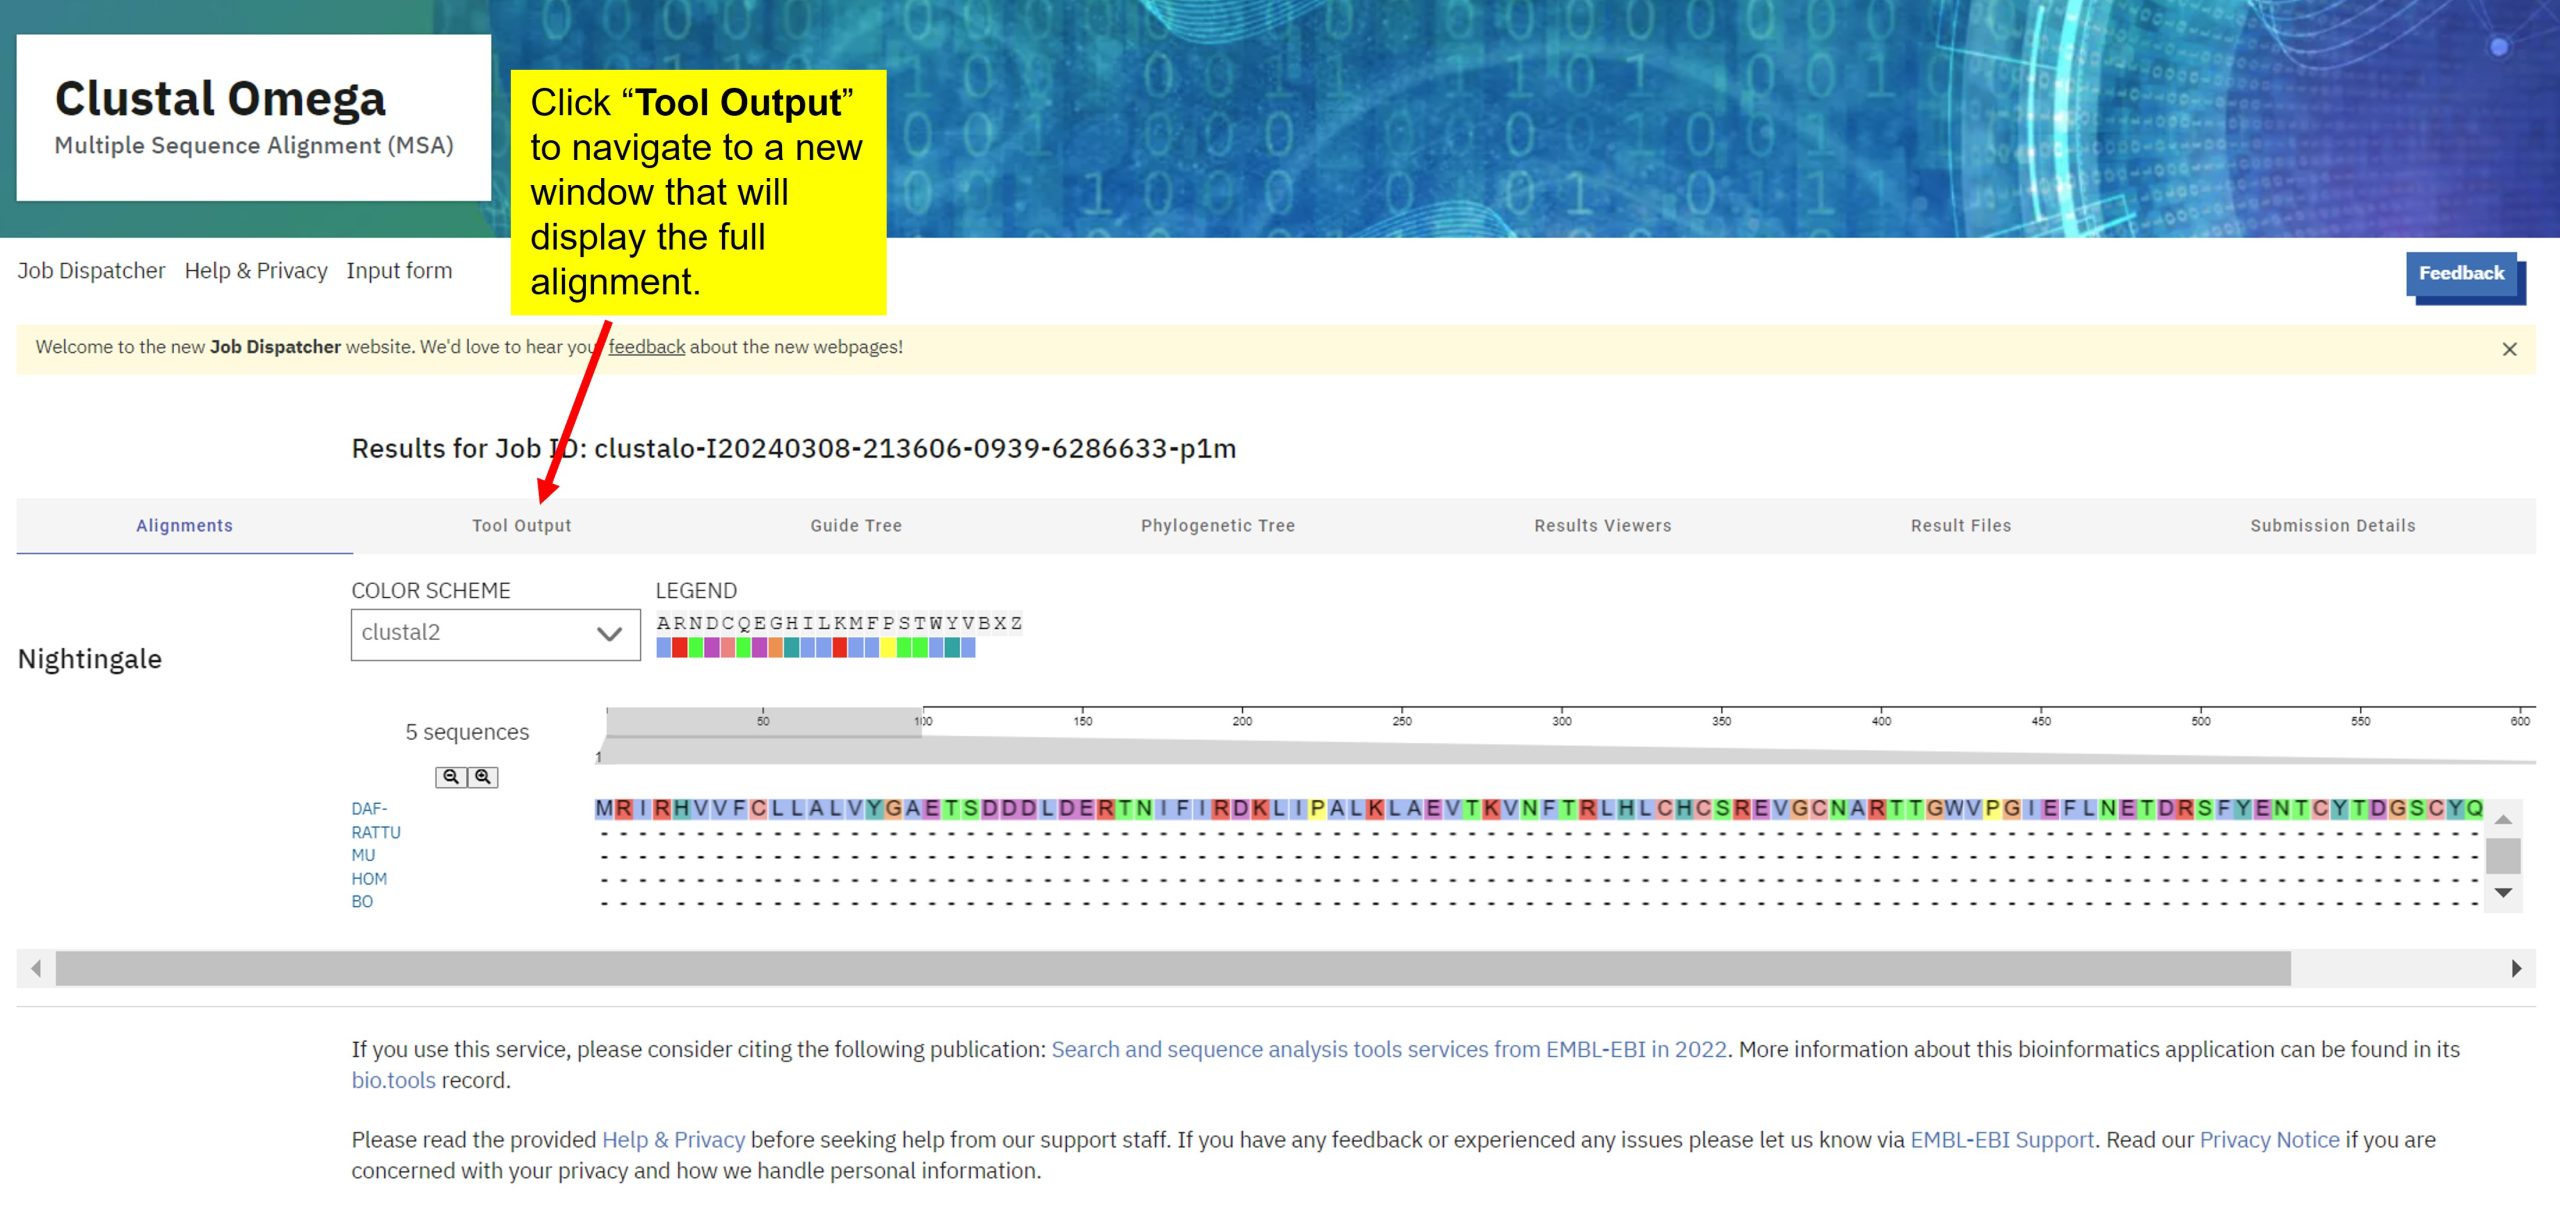
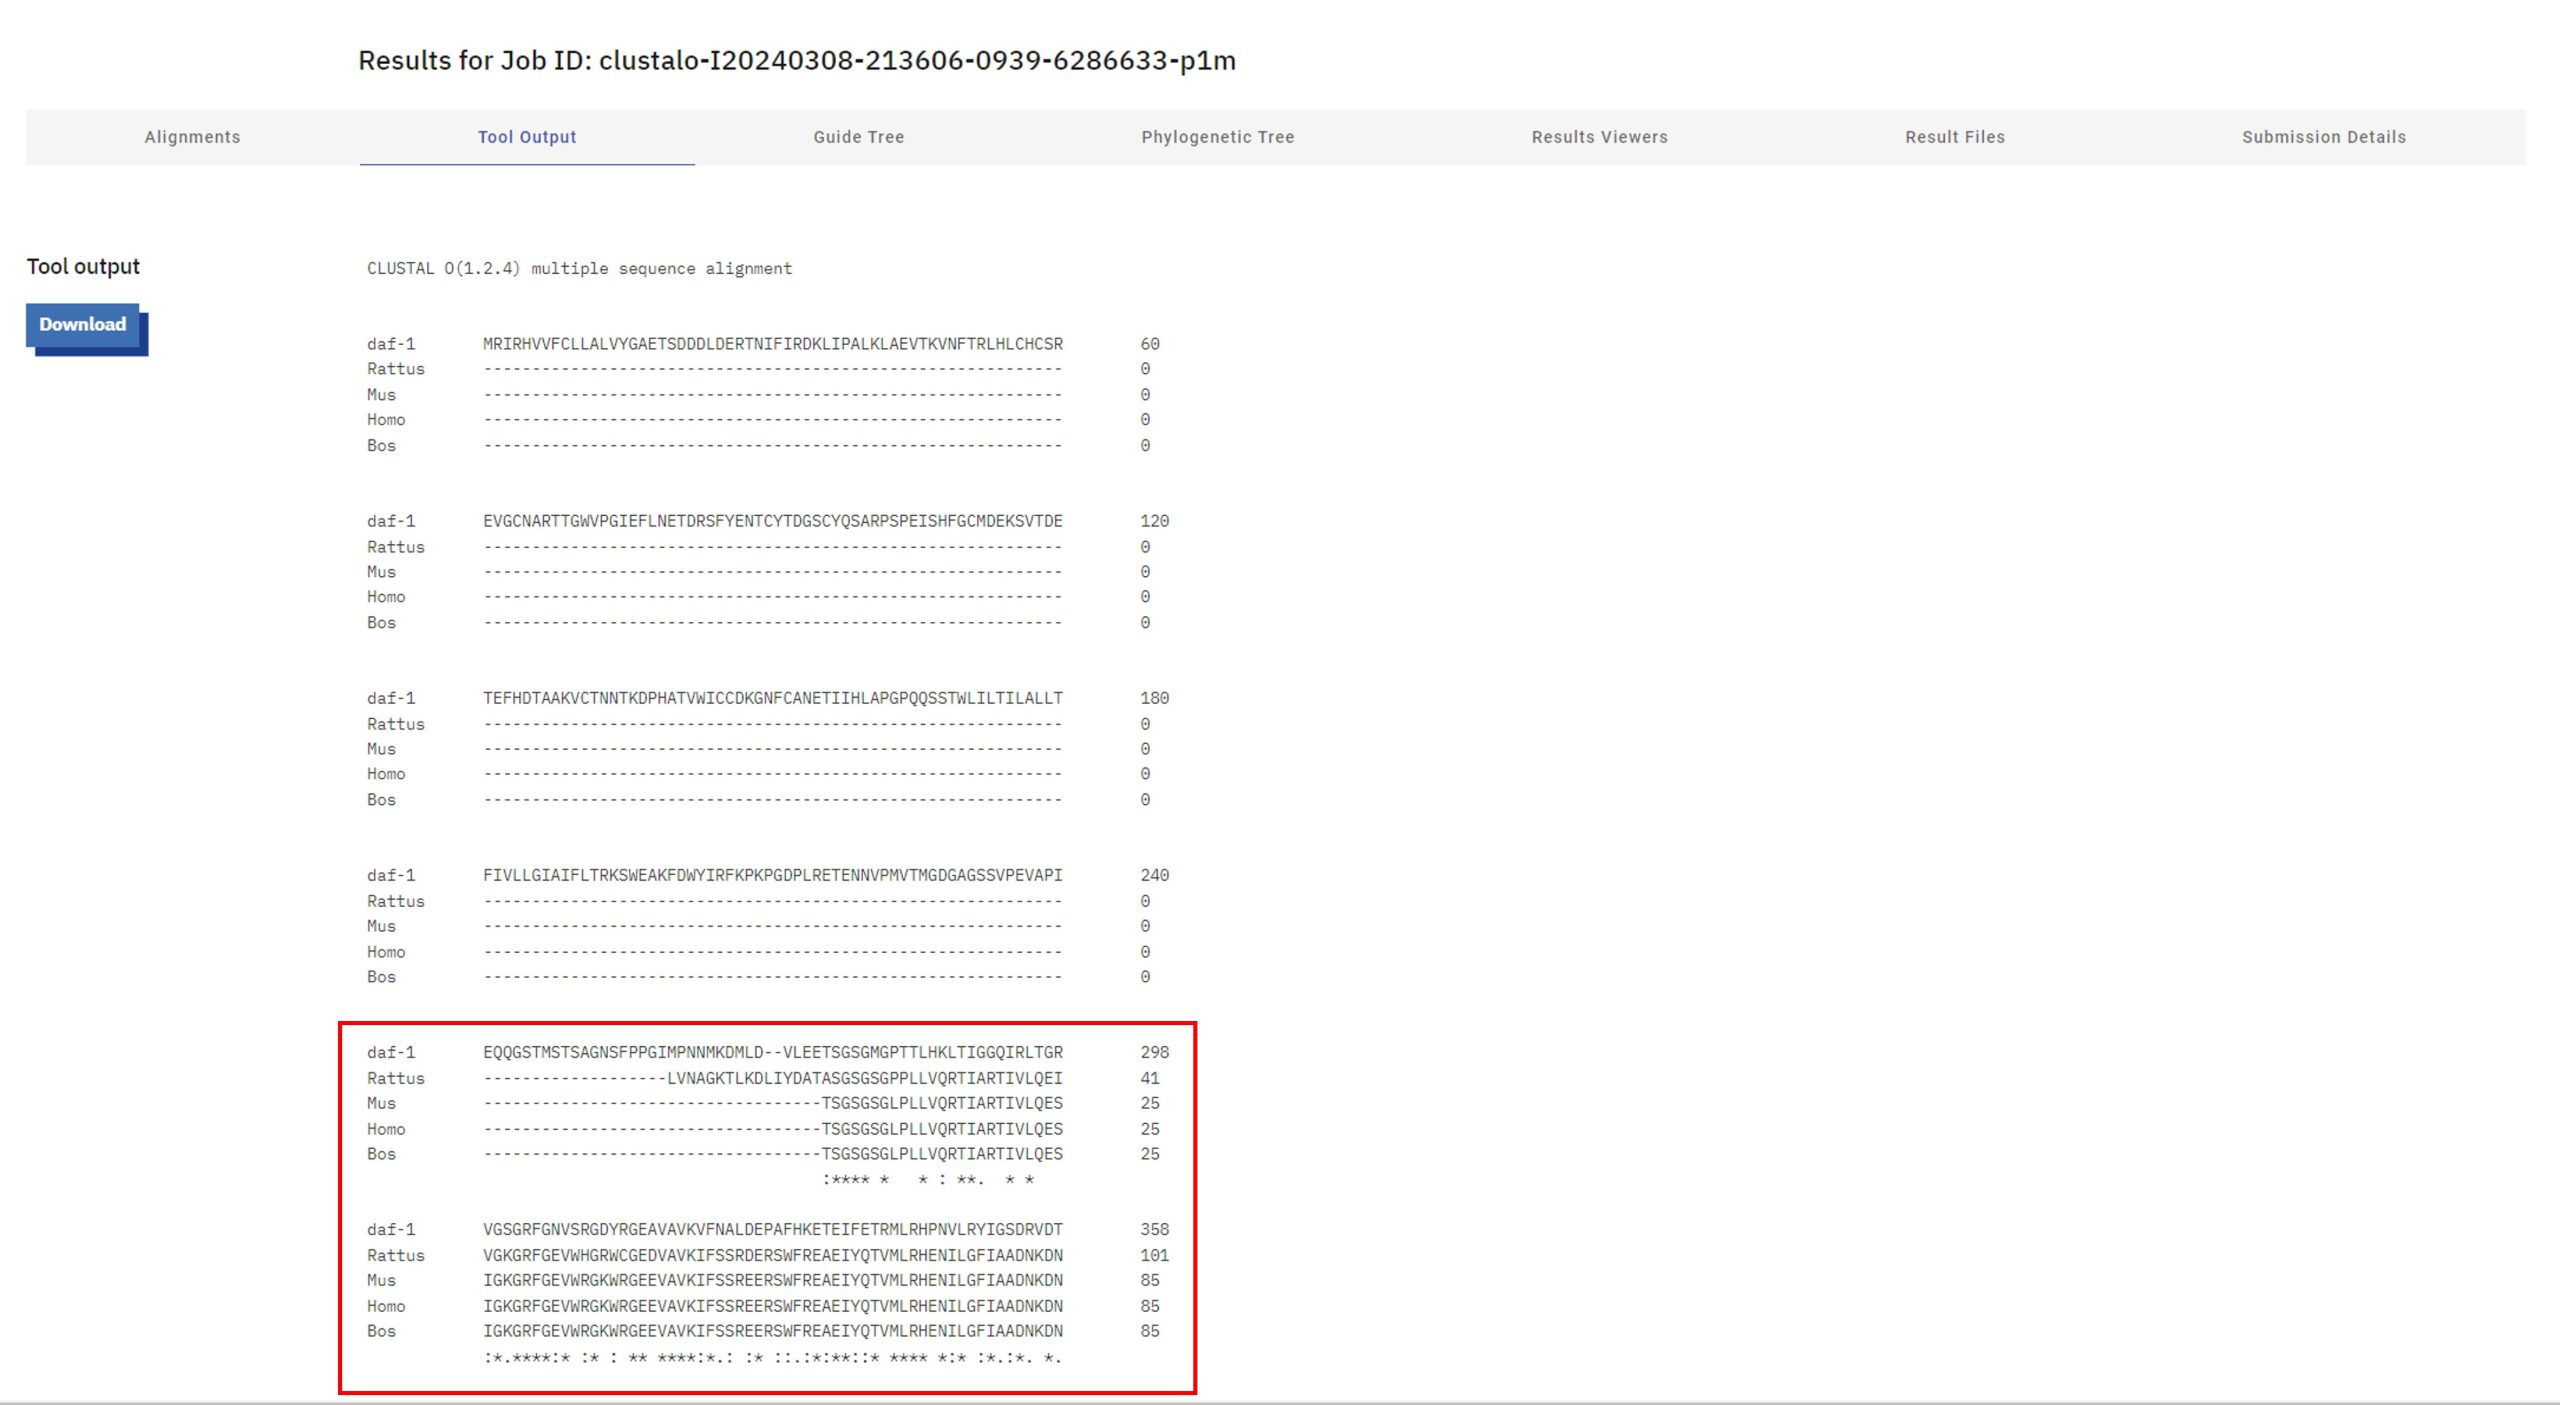
- After a few minutes, the amino acids are aligned based upon identical amino acids and those with similar properties. It will look similar to what you see below (figure 10).
- Select the "Tool Output" tab to see the full length of your alignment. You can also see your alignment in colour by scrolling down the page and selecting "Show" under "Alignment with Colours" (left-hand side of the screen).
- The FAQ section on Clustal Omega will provide additional information on what the different symbols represent, and this link summarizes what the colours represent in the "clustal2" colour scheme. There is also the Help and Documentation page that you may find useful.
Lab Part 4 Questions
Reminder: Provide a web link for any acquired information instead of citation and reference list. This is to save you time in completing the ELN.
4A. Take a screen capture of your final alignment. If the alignment spans more than one screen/page, capture a region of the alignment that shows the most overlap between all of the sequences you provided.
Note: You must include a minimum of 3 sequences for Clustal Omega to construct an alignment. Things to consider when constructing your alignment:
- Are there regions of the protein sequences with strong alignment? Are there regions that seem quite different among the sequences?
- You may want to rerun alignments with fewer sequences, clustering those that are most similar in smaller searches.
4B. Are there gaps in alignment (i.e. where one or more sequences are not aligned with others)? Do these gaps seem to group by organism? In other words, are there sequences that seem to substantially diverge, either at the beginning or end of the sequence, that seem to be shared by organisms more closely related evolutionarily?
4C. Are there regions with substantial sequence identity (same exact amino acids), with sequence similarity (same TYPE of amino acid: acidic, neutral, etc.)? What might these blocks of similarity represent? (Hint: this was discussed in lecture)
Lab Exit Checklist
- Identify the model organism and candidate gene you have been assigned. Search your gene on the database for your assigned model organism (nematode or fruit fly or mouse or yeast).
- Use the information from these two databases, or other additional sources (e.g. review articles) to research your gene/model organism and answer lab part 1 questions.
- Find your gene entry on the NCBI - gene database. Use the information listed under your gene entry on the NCBI database to answer lab part 2 questions.
- Find the protein sequence for your gene of interest and use it to conduct a BLASTp search to identify homologous protein sequences. Answer the lab part 3 questions.
- Reminder: In question 3A, you should have a total of 5 protein sequences in your text file:
- Protein sequence from your assigned gene of interest
- Five homologous protein sequences (humans plus four different animal taxa of your choice)
- Use Clustal Omega to construct a protein sequence alignment comparing the protein sequence from your gene of interest with the homologous protein sequences you identified from your BLASTp search. Answer the lab part 4 questions.
References
Letunic, I. (2008). Tree of Life. Retraced by Mariana Ruiz Villarreal: LadyofHats. The image was generated using iTOL: Interactive Tree Of Life, an online phylogenetic tree viewer and Tree Of Life resource. SVG retraced image from ITOL Tree of life.jpg[2]. https://commons.wikimedia.org/wiki/File:Tree_of_life_SVG.svg
National Center for Biotechnology Information (NCBI). (n.d.). BLAST Topics. National Library of Medicine (US). Retrieved January 22, 2021, from https://blast.ncbi.nlm.nih.gov/Blast.cgi?CMD=Web&PAGE_TYPE=BlastDocs&DOC_TYPE=BlastHelp

