"
Skip to content
Logo for Open Library Publishing Platform

Primary Navigation

  • Home
  • Read
  • Sign in

Want to create or adapt books like this? Learn more about how Pressbooks supports open publishing practices.

Book Contents Navigation

Contents
  1. Land Acknowledgement

  2. Introduction and Acknowledgements

  3. Chapter 1: Exploring Technical Communication
    1. 1.1: Understanding Technical Communication

    2. 1.2: Determining an Approach

    3. 1.3: Reviewing Conventions

    4. 1.4: Analyzing and Adapting to Your Audience

    5. 1.5: Using a Writing Process

    6. Chapter 1: Review

  4. Chapter 2: Choosing a Writing Approach and Design
    1. 2.1: Examining the Direct Approach

    2. 2.2: Considering Readability

    3. 2.3: Choosing Headings

    4. 2.4: Creating Lists

    5. Chapter 2: Review

  5. Chapter 3: Communicating in the Workplace
    1. 3.1: Texting

    2. 3.2: Sending Emails

    3. 3.3: Composing Memos

    4. 3.4: Writing Letters

    5. Chapter 3: Review

  6. Chapter 4: Using a Technical Writing Style
    1. 4.1: Being Reader-Centred

    2. 4.3: Understanding Formality in Writing

    3. 4.2: Using the 7Cs and an Appropriate Writing Style

    4. Chapter 4: Review

  7. Chapter 5: Writing Informal Reports
    1. 5.1: Preparing Proposals

    2. 5.2: Developing Incident and Inspection Reports

    3. 5.3: Composing Feasibility and Recommendation Reports

    4. 5.4: Preparing Progress Reports

    5. 5.5: Developing Lab Reports

    6. Chapter 5: Review

  8. Chapter 6: Writing Formal Reports
    1. 6.1: Formal Report—Report Sections

    2. 6.2: Formal Report—Cover Letter, Title Page, and Statement of Authorship

    3. 6.3: Formal Report—Abstract/Summary

    4. 6.4: Formal Report—Table of Contents and List of Figures

    5. 6.5: Formal Report—Introduction and Discussion

    6. 6.6: Formal Report—Conclusion, Recommendations, References, and Appendices

    7. Chapter 6: Review

  9. Chapter 7: Finding Research for Reports
    1. 7.1: Using Research

    2. 7.2: Starting and Narrowing Research

    3. 7.3: Selecting Source Types

    4. 7.4: Finding Sources

    5. 7.5: Evaluating Sources

    6. Chapter 7: Review

  10. Chapter 8: Integrating Research
    1. 8.1: Using Citations and Avoiding Plagiarism

    2. 8.2: Incorporating Quotations

    3. 8.3: Including Paraphrases

    4. 8.4: Writing Summaries

    5. 8.5: Using Signal Verbs

    6. 8.6: Referring to Authors and Titles

    7. Chapter 8: Review

  11. Chapter 9: Using Graphics in Reports
    1. 9.1: Understanding Graphics

    2. 9.2: Creating Tables

    3. 9.3: Formatting Graphs

    4. 9.4: Using Illustrations, Diagrams, and Photos

    5. Chapter 9: Review

Writing in a Technical Environment (First Edition)

9.4: Using Illustrations, Diagrams, and Photos

Learning Objectives

  • Explore the uses of and guidelines for illustrations, diagrams and photos

How Are Illustrations, Diagrams, and Photos Used?

Illustrations, diagrams, and photos include varying levels of detail. Illustrations are drawings, often simple line drawings. Diagrams are an abstract, schematic view of things such as a diagram of the wiring of laboratory equipment. Photographs provide the most detail since they capture the item fully and without simplification. These graphics—given their different levels of detail—have varying uses. Here are some examples:

  • In feasibility, recommendation, and evaluation reports, photographs are often used. For example, if you are recommending a type of 3D printer, you might want to include photos of the leading contenders.
  • In descriptions, drawings or diagrams are often used. The drawings will often include detail, such as shading and depth perspectives.
  • In instructions,  simple illustrations/drawings (often called line drawings) are the most common. They simplify the situation and the objects so that the reader can focus on the key details.

How Are Illustrations, Diagrams, and Photos Formatted?

When you use an illustration, diagram, or photo in a report, there are several requirements to keep in mind:

  • Include labels: Just about any illustration, diagram, or photo should contain labels—words and phrases—with pointers to the parts of the things being depicted.
  • Create keys: If the illustration or diagram has certain shadings, colours, line styles, or other such details that have a special meaning, these should be indicated in a key.
  • Create a title and number: Except in special cases, illustrations, diagrams and photos should have titles, and these titles should be numbered (Figure 1, Figure 2, and so on). 
  • Write about It: Illustrations, diagrams, and photos should be referred to from the relevant point in the discussion. Be sure to focus readers’ attention on the key details and offer analysis/interpretation if relevant. 
  • Locate appropriately: Ideally, you place illustrations, diagrams, and photos just after the point where they are needed. However, sometimes because of the pagination (the way the text falls on the pages) and the size of the graphic, this close placement is not possible. 
  • Size to fit: Illustrations, diagrams, and photos should be between one-half to one-quarter of the vertical size of the page. You want them to fit on the page with other text. In fact, that’s what you really want—to intersperse text and graphics in a report. Given this, re-size the item appropriately. 
  • Include appropriate detail: You want illustrations, diagrams and photos to be at the right technical level for your readers. 
  • Cite: As always, acknowledge your sources.

Example: Illustration

Harvester diagram

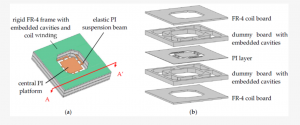
Illustration is by Yi Chiu and Hao-Chiao Hong and licensed under CC BY 4.0


Example: Labeled DiagramDiagram is by Xiaokui Liu, Feng Gao, & Qingju Jiao and licensed under CC BY 4.0


Example: Photograph

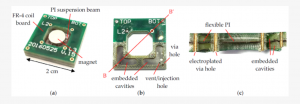
Photograph is by Yi Chiu and Hao-Chiao Hong and licensed under CC BY 4.0

References & Attributions

References

Chiu, Y., & Hong, H. (2018). Rigid-flex PCB technology with embedded fluidic cavities and its application in electromagnetic energy harvesters. Micromachines (Basel), 9(6), 308. https://doi.org/10.3390/mi9060308

Liu, X., Gao, F., & Jiao, Q. (2021). Massive open online course fast adaptable computer engineering education model. Complexity (New York, N.Y.), 2021, 1-11. https://doi.org/10.1155/2021/5934488

Attributions

Content on this page is adapted from Open Technical Communication: Chapter 4: Document Design, which is licensed under a Creative Commons Attribution 4.0 International License.


Previous/next navigation

Previous: 9.3: Formatting Graphs
Next: Chapter 9: Review

License

Icon for the Creative Commons Attribution-NonCommercial-ShareAlike 4.0 International License

Writing in a Technical Environment (First Edition) Copyright © 2022 by Centennial College is licensed under a Creative Commons Attribution-NonCommercial-ShareAlike 4.0 International License, except where otherwise noted.

Share This Book

Share on X Share on LinkedIn Share via Email

Powered by Pressbooks

  • Pressbooks User Guide
  • |Pressbooks Directory
  • |Contact
Pressbooks on YouTube Pressbooks on LinkedIn