9.3: Formatting Graphs
Learning Objectives
- Explore the uses of and guidelines for graphs
How Are Graphs Used?
Graphs are another way of presenting data. Compared to a table, you get more visual impact and less detail in a graph. Given this, use a graph when the visual impact of the data is important. Statistics Canada (2021) suggests using graphs “because they are quick and direct, highlight the most important facts, facilitate [the readers’] understanding of the data, can convince readers, and can be easily remembered” (para. 3).
What Is the Format of a Graph?
There are many possible formats for a chart or graph. The most common ones that you may use when writing in a technical environment include a pie chart, line chart, bar chart, and scatterplot. The following table describes theses types of graphs and how they can be used.
| Type of Graph | Description & Use (Statistics Canada, 2021) |
| Pie | “[A] pie chart usually shows the component parts of a whole. Sometimes you will see a segment of the drawing separated from the rest of the pie in order to emphasize an important piece of information. This is called an exploded pie chart. |
| Line | “A line chart is a visual comparison of how two variables—shown on the x- and y-axes—are related or vary with each other. It shows related information by drawing a continuous line between all the points on a grid.” |
| Bar | “A bar chart may be either horizontal or vertical. The important point to note about bar charts is their bar length or height—the greater their length or height, the greater their value. Bar charts … present data in a visual form so that the reader may readily recognize patterns or trends.” |
| Scatterplot | “The scatterplot is widely used to present measurements of two or more related variables … In a scatterplot, the data points are plotted but not joined. The resulting pattern indicates the type and strength of the relationship between two or more variables.” |
There are a few key points you need to consider before creating any graph: 1) Define your idea or message; 2) Identify the data needed; 3) Select the graph type; 4) Identify the values that should appear on the X and Y axes (if relevant to the type of graph).
Here are some guidelines for graphs:
- Use axis labels: In bar charts and line graphs, don’t forget to indicate what the x and y axes represent by including labels.
- Include a legend: Bar charts, line graphs, and pie charts often use special color, shading, or line style (solid or dashed). Be sure to indicate what these mean; translate them in a legend/key.
- Create a figure title: For most graphs, you’ll need to include a title with a number. Readers need some way of knowing what they are looking at.
- Write about it: Whenever you use a graph, don’t forget to write about it in the text of your report. This should include a description/explanation of the graph and your interpretation or analysis of it.
- Cite: When you borrow information to create a graph, be sure to include APA-style citations to indicate the source.
According to Statistics Canada (2021),
“A good graph:
-
- accurately shows the facts,
- grabs the reader’s attention,
- complements or demonstrates arguments presented in the text,
- has a title and labels,
- is simple and uncluttered,
- shows data without altering the message of the data,
- clearly shows any trends or differences in the data,
- is visually accurate (i.e., if one chart value is 15 and another 30, then 30 should appear to be twice the size of 15).”
Example: Bar Graph with Labels
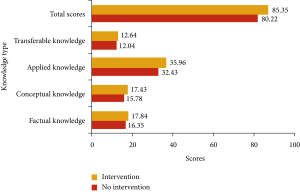
Graph is by Xiaokui Liu, Feng Gao, & Qingju Jiao and licensed under CC BY 4.0
TRY IT
Exercise 9.3.A: Practise Using Graphs
Determine the best type of graph to visually show the data in each of the following Statistics Canada tables. Be sure to consider the message you are communicating. Provide your rationale for choosing the graph type. Finally, create the graph, following all guidelines on this page.
Statistics Canada. (2021). Area, production and farm gate value of marketed organic fruits and vegetable. https://www150.statcan.gc.ca/t1/tbl1/en/tv.action?pid=3210021201
Statistics Canada. (2022). Electric power generation, monthly generation by type of electricity. https://www150.statcan.gc.ca/t1/tbl1/en/tv.action?pid=2510001501
Statistics Canada. (2022). Personnel engaged in research and development, by geography. https://www150.statcan.gc.ca/t1/tbl1/en/tv.action?pid=2710002301
References & Attributions
References
Chiu, Y., & Hong, H. (2018). Rigid-flex PCB technology with embedded fluidic cavities and its application in electromagnetic energy harvesters. Micromachines (Basel), 9(6), 308. https://doi.org/10.3390/mi9060308
Liu, X., Gao, F., & Jiao, Q. (2021). Massive open online course fast adaptable computer engineering education model. Complexity (New York, N.Y.), 2021, 1-11. https://doi.org/10.1155/2021/5934488
Statistics Canada. (2021). Data visualization. https://www150.statcan.gc.ca/n1/edu/power-pouvoir/ch9/5214821-eng.htm
Attributions
Content on this page is adapted from Open Technical Communication: Chapter 4: Document Design, which is licensed under a Creative Commons Attribution 4.0 International License.
Content on this page is adapted from Beginning Excel, First Edition by Noreen Brown, Barbara Lave, Julie Romey, Mary Schatz, Diane Shingledecker, which is licensed under a Creative Commons Attribution 4.0 International License, except where otherwise noted.
Content on this page is adapted from Statistics Canada, Statistics: Power from Data!, September 2, 2021. This does not constitute an endorsement by Statistics Canada of this product.
