9.2: Creating Tables
Learning Objectives
- Explore the uses of and guidelines for tables
How Are Tables Used?
Tables include rows and columns of numbers and/or words, permitting relatively easy comparison of information. If the data is arranged chronologically (e.g., culture growth over a period of time), the table can show patterns such as rising or falling activity.
The main use of tables is for numerical data. Imagine that you are comparing different models of 3D printers in terms of physical characteristics such as height, depth, length, weight, and so on. This is a perfect use for a table. However, don’t get locked into the notion that tables are strictly for numerical data. Whenever you discuss several items using the same categories/criteria, a table may be useful. For example, imagine that you are comparing several models of a 3D printer on the basis of cost, print speed, supply costs, and warranty terms. This is ideal content for a table; however, it would contain mostly words rather than numbers.
What Is the Format of a Table?
In its simplest form, a table is a group of rows and columns of data. At the top of each column is a heading, which defines or identifies the contents of that column (and often the unit of measurement too). The left edge of the table typically includes row headings, which define or identify the contents of that row. Things get tricky when rows or columns must be grouped or subdivided. In such cases, you have to create row or column subheadings. This situation is illustrated in the following image:
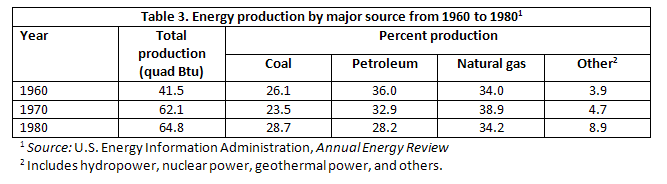
Figure 9.2.A: Format for tables with grouped or subdivided rows and columns.
Here are some guidelines for tables:
- Consider placement: Place the title of a table on top of the table or in the first row of the table.
- Assign a table number and title: Always include a table number and title so that you can refer clearly and specifically to a certain table in the text of your report.
- Write about it: Refer to the table in the text just preceding the table. Explain the general significance of the data in the table; don’t expect readers to figure it out entirely for themselves.
- Simplify: Simplify the table data down to just the amount of data that illustrates your point without, of course, distorting that data.
- Avoid clutter: Don’t put the word or abbreviation for the unit of measurement in every cell of a column. For example, in a column of measurements all in millimeters, don’t put “mm” after every number. Put the abbreviation in parentheses in the column or row heading.
- Use notes: Place special points about one or more of the items in the table in a note under the table rather than in the table itself (as illustrated in Figure 9.2.A).
- Cite: As always, acknowledge your sources.
Occasionally, in rough-draft technical reports, information is presented in text that could be better presented in table form. Be sure to look back over your rough drafts for material that can transformed into tables.
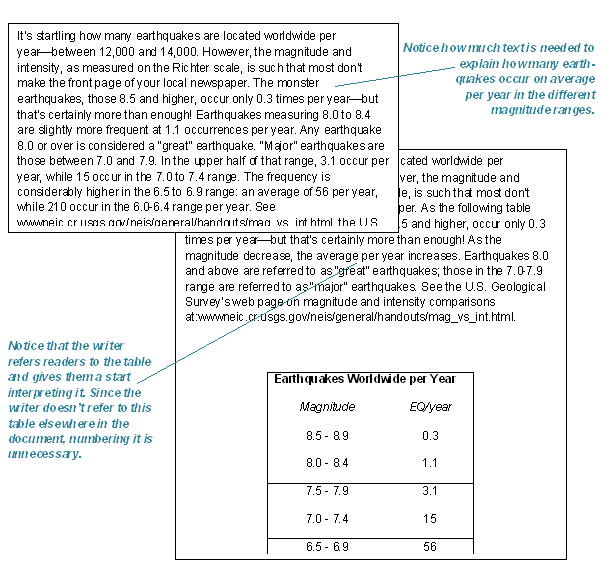
Figure 9.2.B: Example of information included in text that would be better represented in a table.
For APA table guidelines and examples of APA-style tables, see these pages from APA Style: Table Setup and Sample Tables.
TRY IT
Exercise 9.2.A: Create a Table
Using this data from Statistics Canada (2022)—Engineering Service Revenue—create a table that clearly shows the comparison of 2019 to 2020 revenue by engineering service area in Canada.
Be sure to use review and apply the guidelines outlined above.
For more details about this data, visit this page.
References & Attributions
References
Statistics Canada. (2022). Engineering services, sales by type of service. https://www150.statcan.gc.ca/t1/tbl1/en/tv.action?pid=2110021201
Attributions
Content on this page is adapted from Open Technical Communication: Chapter 4: Document Design, which is licensed under a Creative Commons Attribution 4.0 International License.
