9.3 – Ultrasound
Introduction to Ultrasound
Acoustic signals emerge from organized movement of molecules or atoms, which cause local periodic compression of matter (gas, liquids, solid objects). Such spatially propagating, periodically repeating processes are commonly known as waves. Based on the direction of propagation, a distinction between transverse and longitudinal waves is made, where the nature of sound waves is the one of the latter class. Ultrasound relies upon high frequency, inaudible, sound arising from a piezoelectric crystal, in a hand-held transducer, for the creation of images. Hence the nomenclature of “ultrasound”. The ultrasound transducer emits sound roughly 5% of the time and then listens for the returning echoes 95% of the time. Ultrasound transmission is facilitated by acoustic gel that is applied to the probe and to the patient’s skin to minimize the air-gap.
The returning sound is altered in wavelength and intensity and arrives back to the probe after being reflected from tissues of different depths beneath the skin. Based upon the absorptive or reflective properties of the anatomy being assessed, the ultrasound machine assigns a pixel brightness to that particular tissue. A complex, computer driven, algorithm determines the characteristics of the returning echoes and displays the sound on a gray scale. No echoes returning to the transducer is represented as black, while areas that return a larger proportion of the sound to the transducer are white. The image displayed on the ultrasound machine monitor is a real-time, constantly refreshing, image that actively displays the changing location of the ultrasound probe.
Sound waves are mainly characterized by frequency, velocity, wavelength, and intensity. Frequency ξ is measured in Hertz (Hz) and denotes the oscillation count per second. Sound velocity ν within a medium, measured in meters per second (m s−1), is independent of ξ, but varies with material properties such as elasticity and density. The wavelength λ is the distance between two oscillation maxima and measured in meters (m). Finally, the intensity J of a sound wave is measured in Watts per area (W m−2) and denotes the acoustic power density. Typical values for J in ultrasound diagnostics are between 1 and 10 mW cm−2.
**** Figure 9.3.1 Insert Picture of BTEC 315 Ultrasound
Ultrasound Images
Ultrasound images are described in terms of their relative echogenicity. Water is the least complex structure seen on ultrasound and it returns very few echoes back to the transducer, therefore, it has very low echogenicity (anechoic) and is seen as a black structure on the image. An example, of a low echogenicity anatomic structure is a renal cyst or bile in the gallbladder. More complex anatomy results in more sound being echoed back to the ultrasound transducer for conversion to image pixels and is described as being echogenic (brighter) on ultrasound. The liver is an echogenic anatomic structure and is usually more echogenic than the renal cortex (see Fig. 9.3.2).
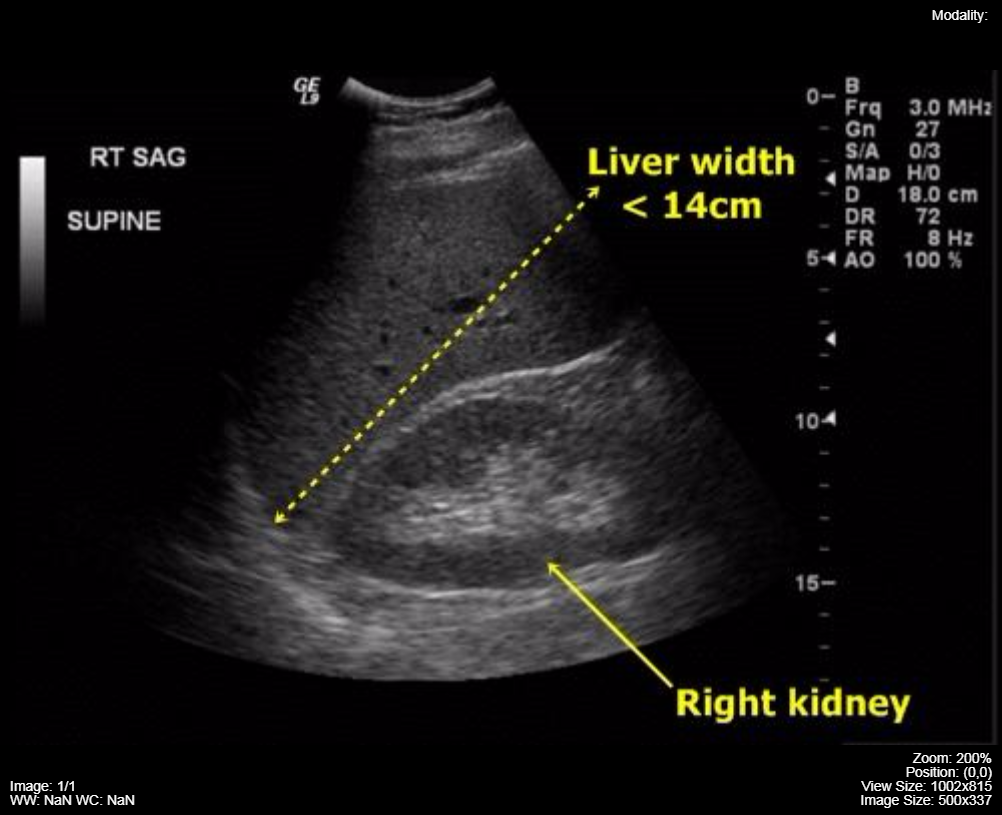
Figure 9.3.2 Ultrasound image of the normal liver and kidney. The echogenicity of the liver is greater than the echogenicity of the adjacent renal cortex.
Ultrasound Probes (Transducers)
Different anatomic structures can be better visualized if the ultrasound transducer is designed to fit the anatomy of the area i.e. convex (curved) transducers are optimal for abdominal and obstetric imaging, linear probes are best adapted to vascular and small superficial structures (thyroid), while the prostate gland is best visualized with a long, wand-shaped ultrasound transducer that can reach the gland via the rectum (endo-cavitary probe). This same physical configuration of the ultrasound probe can be used for intra-vaginal image acquisition for the assessment of female pelvic anatomy (uterus, endometrium, and ovaries). Fig. 9.3.3 contains three common probes, a linear 20 MHz, a curved array 4 MHz and a larger curved array 6 MHz.
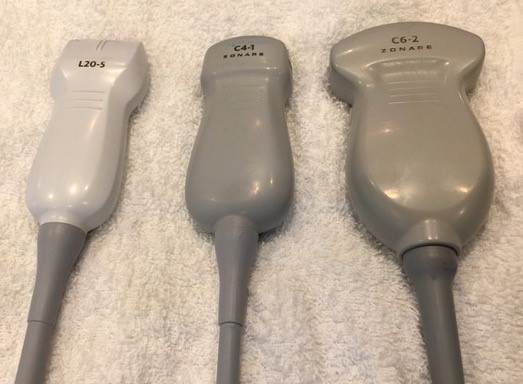
Figure 9.3.3 Linear probe and two curved array probes
A feature of ultrasound probes that effects image quality is the correlation of the frequency of sound emitted with the depth of tissue interrogated. Higher frequency probes have a limited depth of field but provide better image resolution of the near field anatomy. Lower frequency probes are best for deep tissue imaging. Hence, a thyroid ultrasound may be performed with a 20 MHz probe while deep abdomen ultrasound probes are in the 4 – 5 MHz range. Maximal tissue depth for the low frequency probes is approximately 20 cm and these probes do not provide imaging details of the subcutaneous tissues.
The depth of the tissue being imaged from the skin surface limits the ability of ultrasound to view patient anatomy i.e. it would be very unusual to be able to see all of the structures of the abdomen from front to back due to the depth limitation of ultrasound of approximately 15 – 20 cm. Two physical entities that negatively impact ultrasound image quality are the presence of gas in the area (lung, intestinal gas) and bone.
Transducers
An ultrasound transducer functions as both: a generator and a detector of ultrasonic waves. It converts mechanical energy into electrical energy and vice versa. When the transducer is pressed against the skin, it directs high-frequency sound waves into the body. Since sound waves produced by the transducer can barely penetrate air, gel is applied to the skin to help to minimize the amount of air between the transducer and the skin. As the waves penetrate the body, sound echoes are generated from the body’s fluids and tissues due to (diffuse) reflection and scattering. The strength and character of these sound echoes are recorded by the transducer and, depending on the type of transducer, can be transformed into 1-D, 2-D or 3-D images, which can be rendered and viewed to the user.
In order to generate and detect ultrasonic waves, transducers rely on the so-called piezoelectric effect. It describes the conversion of electrical energy into mechanical energy and vice versa in piezoelectric materials. On the one hand, mechanical pressure (pressure translates to “piezo” (gr.)) is converted to electric polarization, which generates electric voltage. The electric voltage can be measured using two electrodes. On the other hand, electrical fields cause contraction or stretching of the piezoelectric material. This contraction and stretching can be used to generate ultrasound waves by applying a high frequency alternating voltage.
Quartz is a solid made of Silicone and Oxygen molecules in a highly ordered structure. Ultrasound transducers contain a quartz crystal. According to the Piezoelectric effect, when electricity passes through a crystal it causes the crystal to vibrate. And conversely, if a crystal is made to vibrate, it emits electricity. The properties of the crystal determine the frequency of the vibration. Inside the transducer, both forms of the
Piezoelectric effect occur. First, the ultrasound waves are generated: electrical energy is applied to the crystal and converted to high frequency
soundwaves, which enter enter the tissue below the transducer. These soundwaves interact with the tissue, and then are reflected back towards the transducer at different frequencies, based on the characteristics of the tissue. When these sound waves return, they interact with the same crystal. Here again, mechanical energy is converted to electrical energy, this time containing information about the tissue it has been reflected from. This energy is then converted to an image. The sound waves emitted by the crystal are in the range of 2-10 Megahertz (mHz, millions of cycles per second.) The tissue below the probe reflects the sound waves differently based on its characteristics. The more dense a tissue is, the more “bright” it appears on the screen. Therefore, the image on the screen is a reflection of the amount of time a sound wave takes
to return to the transducer (depth of the structure) and the strength of the sound wave (brightness of the image.)
Troubleshooting Ultrasound
Fig. 9.3.4 depicts a flow chart for troubleshooting and repair of ultrasound devices.
Figure 9.3.4 Troubleshooting and repair of Ultrasound devices
Attributes
This chapter is adapted from the following:
- Chapter 19 in Undergraduate Diagnostic Imaging Fundamentals by Brent Burbridge is licensed under CC BY-NC-SA 4.0
- Chapter 7 in Medical Imaging Systems: An Introductory Guide by M Berger, Q Yang and A Maier is licensed under CC BY 4.0 courtesy of National Center for Biotechnology Information
- Introduction to Ultrasonography by Richard Davis is licensed under CC BY-SA 3.0
Figures
- 9.3.1
- 9.3.2 and 9.3.3 Ultrasound image of the normal liver and kidney and Linear probe and two curved array probes by Dr. Brent Burbridge MD, FRCPC, University Medical Imaging Consultants, College of Medicine, University of Saskatchewan is used under a CC-BY-NC-SA 4.0 license.
- 9.3.4 Ultrasound Repair and Troubleshooting by Engineering World Health., All Rights Reserved. Used with permission.9.3.4
