Figures
Figure 1
Correlation between Test results and questions asked
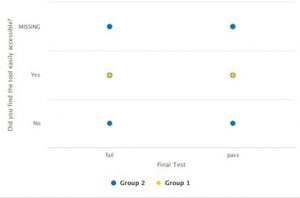
Note: Students were asked at the beginning of week 4 to evaluate the tool. The total percentage of the student population who answered the questions was 64.21%. Graph that shows the final test result based on tool access although the final test had only 10% of the total questions from the articles posted on Hypothes.is.
Figure 2
Correlation between Test results and questions asked
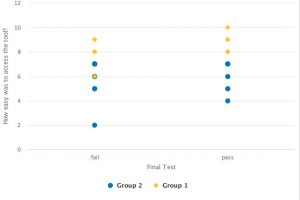
Note: There were some students who had challenges accessing the tool at the beginning. Only 10% of the total test had questions from the articles posted in Hypothes.is
Figure 3
RapidMiner Go ML was used to correlate the results from Question 3 with the Test results
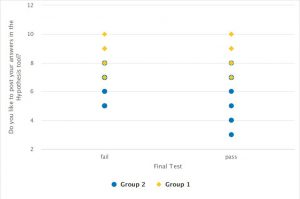
Note: It shows the correlation between students who “pass” even so they did not line to post their answers in the social annotation tool
Figure 4
Weekly in-class participation for 3 sections
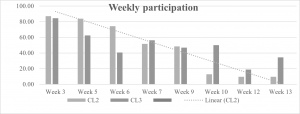
Note: CL1, CL2, CL3 are the 3 sections and weekly participation. During the first weeks, there were more students participating online
Figure 6
Final Test and weekly participation correlation analysis.
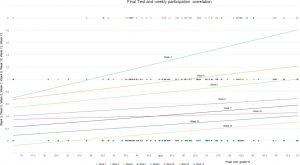
Note: The software used was RapidMiner. Regression interpolation lines are providing information regarding the correlation between online participation and test results.
