8 Drawing Type and Morphology Analysis: Figure Ground Diagram
rdabydeen
Keywords: Urban Morphology; Urban Grain; Urban Form; Pattern
Apps: ArcGIS Pro, ArcGIS Online, Adobe Illustrator, Open Street Maps
A Figure Ground Diagram is a powerful drawing that clearly displays the urban morphology of a neighbourhood.
The purpose of a figure ground is to bring into sharp relief the built form (figures, buildings, “positive” shapes) and the unbuilt form (ground, voids, spaces around buildings, “negative” shapes). It allows us to recognize patterns and organize observations about a city’s built form, or morphology.
In urban design, a figure ground diagram is typically in plan/map/aerial view at the scale of a neighbourhood or larger area. These are often called “figure ground maps.” NOTE: The figure ground technique of juxtaposing positive and negative shapes can be used in perspective drawing as well to highlight the relationships between figures and their background.
This chapter will demonstrate how to create figure grounds using OpenStreetMaps and Adobe Illustrator; however, a similar process can be completed using other GIS software such as ArcGIS Pro. Before we get started, check out some examples of various figure grounds and how they can be integrated into neighbourhood analyses or other diagrams such as the Contextual Appraisal Diagram showcased in the next chapter!
There are several different ways to create figure grounds can be done by-hand or digitally.
TECHNIQUE – By-Hand
Figure grounds can be done by hand as a form of sketching or using trace paper placed over a map or an air photo on a light table and filling in the “positive” and “negative” shapes.
Why would you ever do this by hand?
Hand-drawing always forces us to slow down and become careful observers of place, so it can be a powerful exercise for building understanding of observed patterns. By-hand figure grounds may be useful for creating historic diagrams when mapping data is unavailable, but you have an air photo, and when the hand-drawn aesthetic is preferred. Hand-drawing a figure ground may be preferred for draft diagrams to quickly work out what you want to highlight in your final digital versions.
RECOMMENDED TECHNIQUE – Digital Figure Ground Using Building Footprint Data in ArcGIS
- ArcGIS Pro
- ArcGIS Online
This technique is the most preferred and used widely. ArcGIS is a software used in the planning practice and is considered standard in the profession. Creating figure grounds is very simple in ArcGIS and can be converted into an editable PDF file. Note that this technique is a highly recommended when the building footprint data is available for your location.
FINAL CHECK: *Make sure to save your file as an Illustrator file (Ai) after dragging the figure ground PDF file into Adobe Illustrator. This will ensure that the changes you made will be saved and that the layers you create are maintained if you wish to work on other devices or send the file to others.*
Tip: Selecting Similar Objects or Shapes All At Once
ALTERNATIVE TECHNIQUE – BASE DATA from Open Street Map
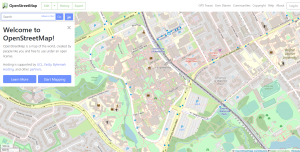
PART A – Go to the website: OpenStreetMap
Note: You will have to create a free OpenStreetMap account to proceed.
Once you are on the website page and have signed in, follow these steps:
1) Locate your selected case study area on the map. You can easily find your study area by typing the location in the search bar. If you cannot find your location, try typing in the nearest road.
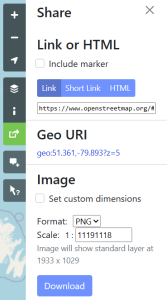
2) Once you have found your location, click on the “Share” icon that is highlighted in green in the image above.
3) Click “Format” to set the export settings to PDF.
4) At this point, choose a scale that best displays the site you are going to show. If you wish, you can also set custom dimensions for the image. Make sure to leave a bit of context (surrounding neighbourhood or features around the site) to give your viewer an understanding of where your site is located in a real-life setting.
5) Once you have selected these options, click “Download.” If you followed the steps correctly, you have successfully created a map of your selected study area in a PDF format. The next step is to import this PDF file into Adobe Illustrator in order to create a figure ground diagram.
FINAL CHECK: *Make sure to move the saved PDF file from the downloaded files into documents or your desired file location on your USB or device*
Did You Know?
You can also create maps using ArcGIS Pro. You would export the final map from ArcGIS as a vector PDF layout. This will allow you to work with polygons from ArcGIS Pro as vectors in Illustrator. This method is another quick and easy alternative that works as well as the method using OpenStreetMaps. We encourage you to try it out if you have access to ArcGIS Pro.
PART B – Launch Adobe Illustrator (Ai) from the applications on the “dock”/taskbar.
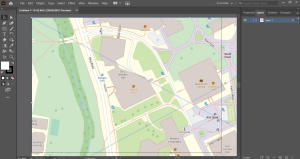
6) Then, you need to open the PDF map that you have saved and exported from OpenStreetMaps. Click “File” and then click “Open.”
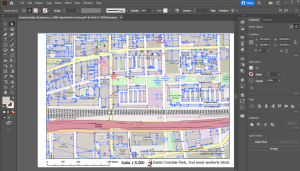
7) Now, choose the PDF map. The PDF should have opened in Adobe Illustrator and can now be edited. Your image should look something like this:
 8) Using the selection tool, select your image and adjust it to fit on your page. It may be easier to zoom out and adjust your image. Press “Ctrl & +” to zoom in and “Ctrl & -” to zoom out in any Adobe software (instead of Ctrl, press Command for Mac).
FINAL CHECK: *Make sure to save your file as an Illustrator file after adjusting your image on the page*
Tip:
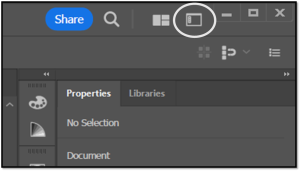 The window that you are working on in Adobe Illustrator is called a “workspace” where you have access to many tools and other options. For anyone starting out, you will want to have the most essential tools to work efficiently in this software. In the top right corner, click the “Switch Workspace” button and check “Essentials Classic”. Now you will have access to all the essential tools you need to draw and adjust your image throughout this tutorial.
PART C – Editing and Deleting Excess Mapping
Your map might look like the image below. If it does here are the steps to delete the extra buildings and open space without hindering your map. These extra elements might allow your computer to run more smoothly.
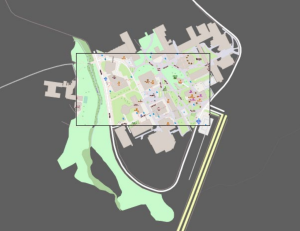
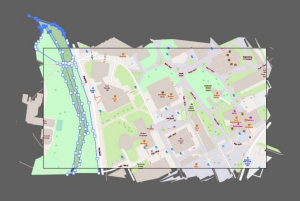
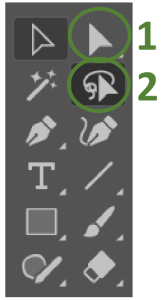 Figure Ground Editing:
Tool 1: Direct Selection Tool (The Direct Selection Tool can select or modify specific path segments or points of a shape in the image)
Tool 2: Lasso Tool (Recommended: The Lasso Tool can select a portion of the image or one specific image, allowing you to delete or edit it as seen in the right image)
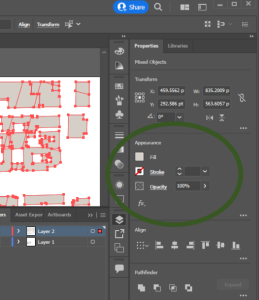
9) Click on the “Direct Selection Tool” and click on one of the building footprints.
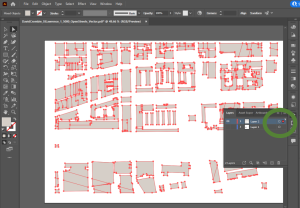
10) In the ribbon above, click on “Select,” which is in between “Type” and “Effect.” A dropdown menu should appear and then click on “Same.” Another dropdown menu should appear and now click on “Appearance.” The image below shows steps 9 and 10 applied to the PDF map in Adobe Illustrator.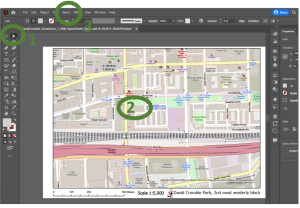
FOURTH – Creating A New Layer with Selected Building Footprints
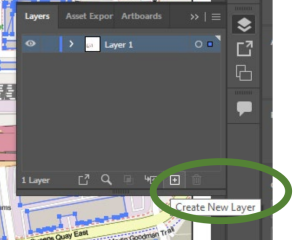 11) After following the steps above to select the building footprints, you should now see something similar to the right image above on your screen. At this point, press “Ctrl C” (Command C to copy on Mac) and then create a new layer, as seen in the image to the right.
12) With Layer 2 active (highlighted in blue), press “Shift Ctrl V” (Shift Command V to paste the selected building footprints in the exact location on Mac) to paste IN PLACE your selected objects into Layer 2. Now, click the eye next to Layer 1, and Layer 1 will no longer be visible.
Another method to copy and paste the selected building footprints into Layer 2 is to drag the blue dot on Layer 1’s tab to Layer 2’s tab. This action will perform the same command above to move the selected images into Layer 2.
You will now see something similar in the image below on your screen.
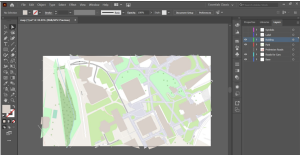
13) An essential step is to name your layers. Labelling your layers will be useful in organizing layers as categories, such as building footprints, open spaces, parks, roads, labels and more. This step is also helpful when editing to understand what shapes you are editing. If there are shapes that you do not want to edit, you can hide what you do not want to see or edit while keeping other layers visible. An example of labelling layers and turning off or “hiding” layers can be seen in the image below. In this case, the labels and symbols layers are turned off.
PART D – Creating Figure Ground
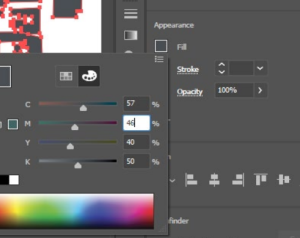
14) Finally, it is time to apply a fill colour to the building footprints now that they are isolated in a new layer. In the properties panel look under “appearance” and click on the block beside “fill” as seen in the image to the left. Click on the painter’s palette symbol and pick a dark grey (e.g. c: 57, m:46, y:40, k: 50) as shown on the right image.
 .
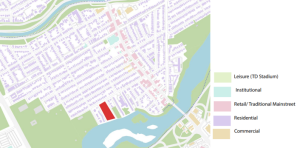
. 15) You have successfully created a figure ground diagram! However, you can apply different colours for different buildings using the Lasso Tool or the Direct Selection Tool to select specific buildings.
This is a good way to show differences in height, density or land use, but keep the morphological analysis value of the figure ground. For instance, you can make something similar to the image below.
FINAL CHECK: *Make sure to lock other layers to ensure you do not select them when using the Lasso Tool or Direct Selection Tool*
Adding Scale Ratio Text and North Arrow:
![]() Sometimes after opening a PDF map in Adobe Illustrator, the scale ratio text and north arrow do not import into the software properly.
Sometimes after opening a PDF map in Adobe Illustrator, the scale ratio text and north arrow do not import into the software properly.
You can use the Text Tool to add the scale ratio text.
You can also create a new north arrow in Illustrator too. Go to “Window” located on the top ribbon. A dropdown menu will appear and then click “Symbols.” Next, click on the library book symbol in the bottom left, then select “Arrows.” Pick an arrow and use the Text Tool to type “N” which can be rotated to match the correct north direction.
How to Assess a Figure Ground?
Here are some key considerations when describing the urban pattern revealed through a figure ground:
Street And Block Patterns:
- Grid or Non-Grid (Regular, Irregular, Curvilinear – cul-de-sac & pod)
- Hierarchy (Hierarchical or non; arterials, collectors, locals)
- Grain (Fine versus Coarse)
- Fabric (Continuous, Interrupted, Severed, Breaks/Juxtaposition)
- Shape (Linear, Concentric, Radial)
- Mesh & Permeability
- Enclosing Pattern or Open/Floating
Lot & Parcel Patterns:
- Depth, Width, Regular/Irregular, Rectangular/Pie-Shaped, Large
Building & Use Patterns:
- Mass (Large, Small), Shape, Orientation, Setbacks, Typology, and More!
Author: Ricardo Dabydeen and Rachel
Urban morphology or the morphology of a urban area is the study of change in the physical form and shape of settlements or neighbourhoods over time. This study focuses on the growth and changes in the patterns and processes that occur or exist within these settlements (Carmona et al., 2021, p. 196).
GIS stands for Geographic Information Systems. Geographic Information Systems are widely used today and go beyond what you can do using Google Maps. GIS is a spatial analysis tool that enables users to work with spatial data (data referenced by spatial or geographic coordinates) to perform several analyses directed at maps or specific locations (Star and Estes, 1990).
To learn more about GIS, visit Esri, the developer of ArcGIS Pro, for a more in-depth look at this incredible spatial system.
