Chapter 2.5: Inverse Functions
Learning Objectives
- Determine the conditions for when a function has an inverse.
- Use the horizontal line test to recognize when a function is one-to-one.
- Find the inverse of a given function.
- Draw the graph of an inverse function.
- Evaluate inverse trigonometric functions.
An inverse function reverses the operation done by a particular function. In other words, whatever a function does, the inverse function undoes it. In this section, we define an inverse function formally and state the necessary conditions for an inverse function to exist. We examine how to find an inverse function and study the relationship between the graph of a function and the graph of its inverse. Then we apply these ideas to define and discuss properties of the inverse trigonometric functions.
Existence of an Inverse Function
We begin with an example. Given a function  and an output
  , we are often interested in finding what value or values
  were mapped to
  by . For example, consider the function
  . Since any output
  , we can solve this equation for to find that the input is
 ![x=\sqrt[3]{y-4}](https://ecampusontario.pressbooks.pub/app/uploads/quicklatex/quicklatex.com-3eff01691544f2871ad7ab299afb0348_l3.png "Rendered by QuickLaTeX.com") . This equation defines as a function of . Denoting this function as
. This equation defines as a function of . Denoting this function as  , and writing
 ![x=f^{-1}(y)=\sqrt[3]{y-4}](https://ecampusontario.pressbooks.pub/app/uploads/quicklatex/quicklatex.com-121666632c01b2c08e82e1b3edd87f78_l3.png "Rendered by QuickLaTeX.com") , we see that for any in the domain of
, we see that for any in the domain of  . Thus, this new function, , “undid” what the original function did. A function with this property is called the inverse function of the original function.
Definition
Given a function with domain  and range
  , its inverse function (if it exists) is the function with domain and range such that
  if
if  . In other words, for a function and its inverse ,
 for all in , and
  for all in .
Note that is read as “f inverse.” Here, the -1 is not used as an exponent and  . (Figure) shows the relationship between the domain and range of and the domain and range of .
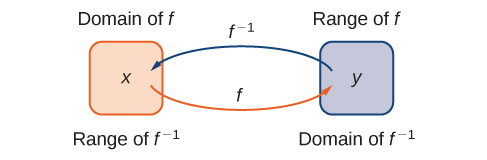 and its inverse
  if and only if . The range of becomes the domain of and the domain of becomes the range of .
Recall that a function has exactly one output for each input. Therefore, to define an inverse function, we need to map each input to exactly one output. For example, let’s try to find the inverse function for  . Solving the equation
  for , we arrive at the equation
  . This equation does not describe as a function of because there are two solutions to this equation for every
  . The problem with trying to find an inverse function for is that two inputs are sent to the same output for each output . The function discussed earlier did not have this problem. For that function, each input was sent to a different output. A function that sends each input to a different output is called a one-to-one function.
Definition
We say a is a one-to-one function if  when
when  .
.
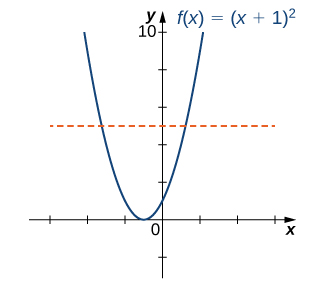
One way to determine whether a function is one-to-one is by looking at its graph. If a function is one-to-one, then no two inputs can be sent to the same output. Therefore, if we draw a horizontal line anywhere in the  -plane, according to the horizontal line test, it cannot intersect the graph more than once. We note that the horizontal line test is different from the vertical line test. The vertical line test determines whether a graph is the graph of a function. The horizontal line test determines whether a function is one-to-one ((Figure)).
Rule: Horizontal Line Test
A function is one-to-one if and only if every horizontal line intersects the graph of no more than once.
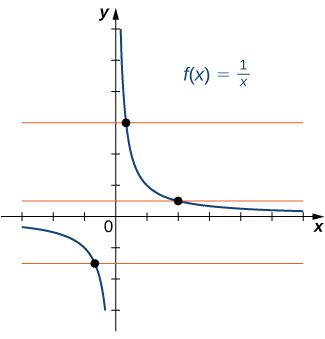
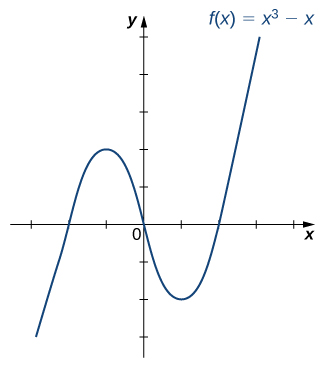
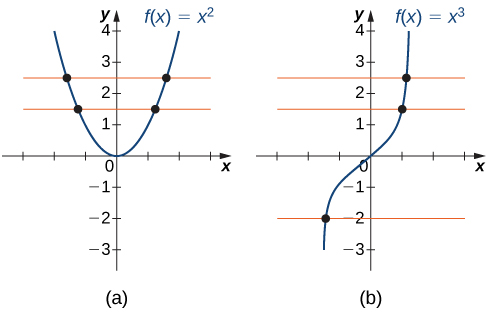 is not one-to-one because it fails the horizontal line test. (b) The function
  is one-to-one because it passes the horizontal line test.
Determining Whether a Function Is One-to-One
For each of the following functions, use the horizontal line test to determine whether it is one-to-one.
Solution
- Since the horizontal line
 for any integer
  intersects the graph more than once, this function is not one-to-one.
- Since every horizontal line intersects the graph once (at most), this function is one-to-one.
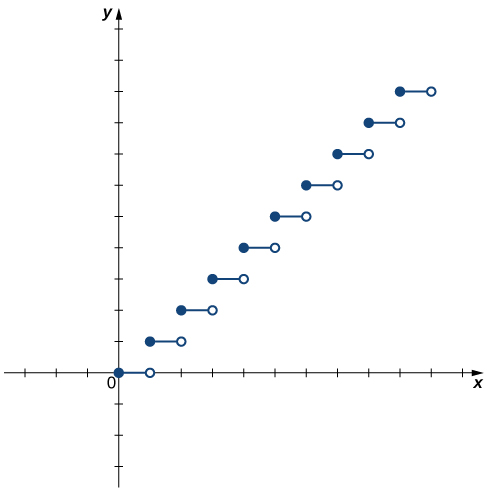
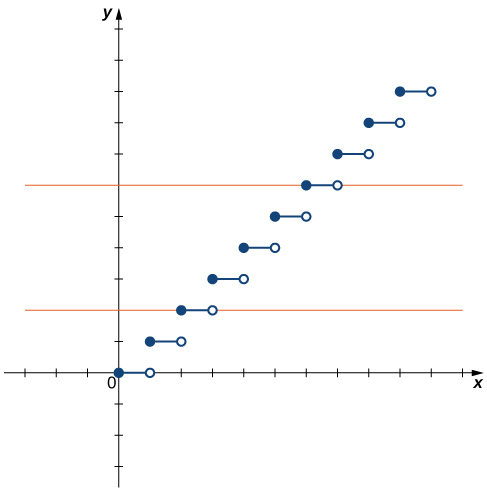
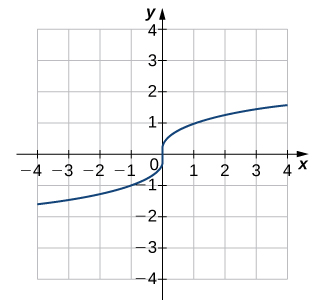
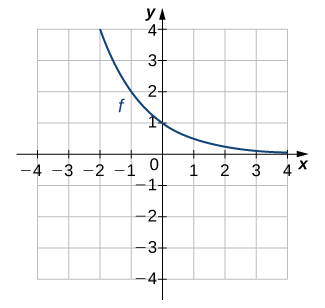
Is the function graphed in the following image one-to-one?
Solution
No.
Finding a Function’s Inverse
We can now consider one-to-one functions and show how to find their inverses. Recall that a function maps elements in the domain of to elements in the range of . The inverse function maps each element from the range of back to its corresponding element from the domain of . Therefore, to find the inverse function of a one-to-one function , given any in the range of , we need to determine which in the domain of satisfies . Since is one-to-one, there is exactly one such value . We can find that value by solving the equation for . Doing so, we are able to write as a function of where the domain of this function is the range of and the range of this new function is the domain of . Consequently, this function is the inverse of , and we write  . Since we typically use the variable to denote the independent variable and to denote the dependent variable, we often interchange the roles of and , and write
  . Representing the inverse function in this way is also helpful later when we graph a function and its inverse on the same axes.
Problem-Solving Strategy: Finding an Inverse Function
- Solve the equation for .
- Interchange the variables and and write .
Finding an Inverse Function
Find the inverse for the function  . State the domain and range of the inverse function. Verify that .
Solution
Follow the steps outlined in the strategy.
Step 1. If  , then
  and
and  .
.
Step 2. Rewrite as  and let .
Therefore,  .
.
Since the domain of is  , the range of is . Since the range of is , the domain of is .
You can verify that by writing
 .
.Note that for  to be the inverse of
  , both and
  for all in the domain of the inside function.
Find the inverse of the function  . State the domain and range of the inverse function.
Solution
 . The domain of is
  . The range of is
  .
.
Hint
Use the (Note) for finding inverse functions.
Graphing Inverse Functions
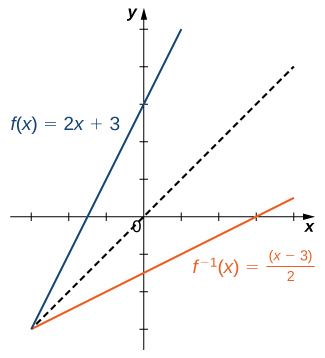
Let’s consider the relationship between the graph of a function and the graph of its inverse. Consider the graph of shown in (Figure) and a point  on the graph. Since
  , then
  . Therefore, when we graph , the point
  is on the graph. As a result, the graph of is a reflection of the graph of about the line
  .
.
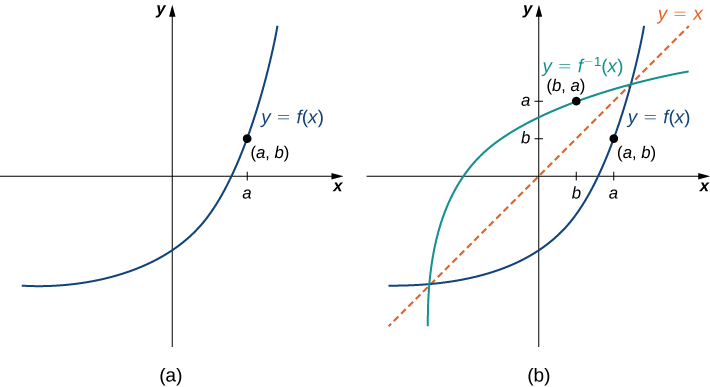 shows point on the graph of . (b) Since is on the graph of , the point is on the graph of . The graph of is a reflection of the graph of about the line .
Sketching Graphs of Inverse Functions
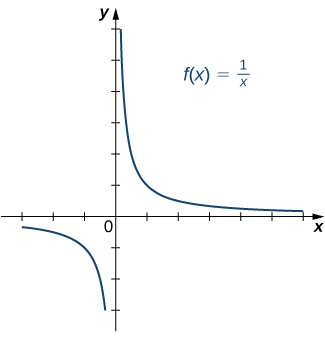
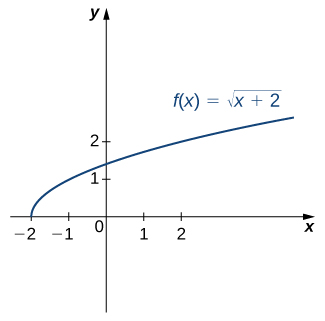
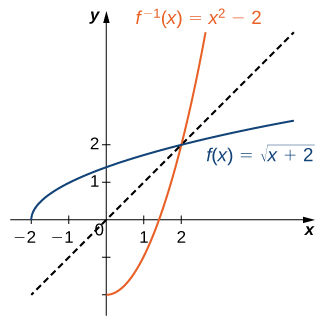
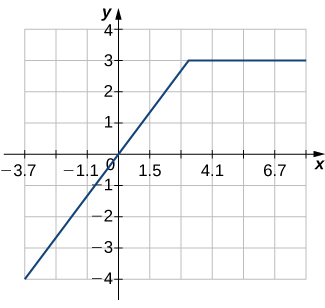
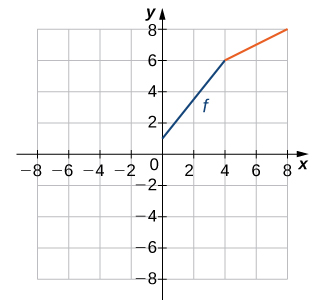
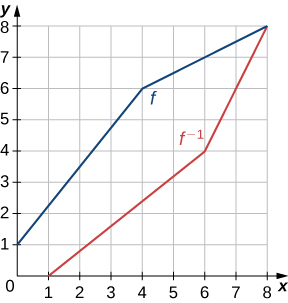
For the graph of in the following image, sketch a graph of by sketching the line and using symmetry. Identify the domain and range of .
Solution
Reflect the graph about the line . The domain of is  . The range of is
  . By using the preceding strategy for finding inverse functions, we can verify that the inverse function is
  , as shown in the graph.
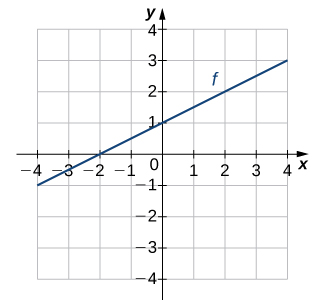
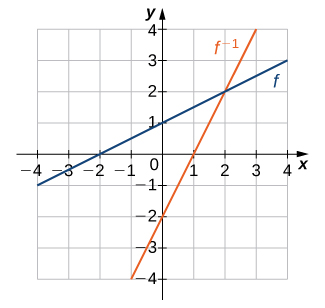
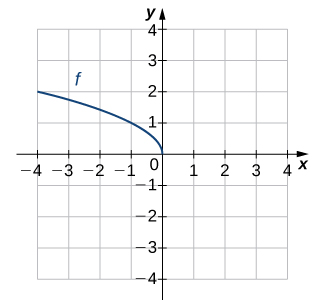
Sketch the graph of  and the graph of its inverse using the symmetry property of inverse functions.
Solution
Hint
The graphs are symmetric about the line .
Restricting Domains
As we have seen, does not have an inverse function because it is not one-to-one. However, we can choose a subset of the domain of such that the function is one-to-one. This subset is called a restricted domain. By restricting the domain of , we can define a new function  such that the domain of is the restricted domain of and
  for all in the domain of . Then we can define an inverse function for on that domain. For example, since is one-to-one on the interval , we can define a new function such that the domain of is and
  for all in its domain. Since is a one-to-one function, it has an inverse function, given by the formula
  . On the other hand, the function is also one-to-one on the domain
 ![(−\infty,0]](https://ecampusontario.pressbooks.pub/app/uploads/quicklatex/quicklatex.com-22c7095d1d71aac28fc670c65d016f44_l3.png "Rendered by QuickLaTeX.com") . Therefore, we could also define a new function
. Therefore, we could also define a new function  such that the domain of is and
  for all in the domain of . Then is a one-to-one function and must also have an inverse. Its inverse is given by the formula
  ((Figure)).
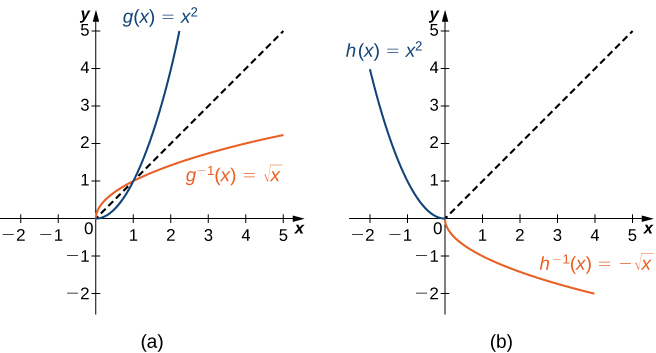 restricted to
  . (b) For restricted to
 ![(−\infty,0], \, h^{-1}(x)=−\sqrt{x}](https://ecampusontario.pressbooks.pub/app/uploads/quicklatex/quicklatex.com-ecbfccf4b86d6fd648fcf4025b09d369_l3.png "Rendered by QuickLaTeX.com") .
.Restricting the Domain
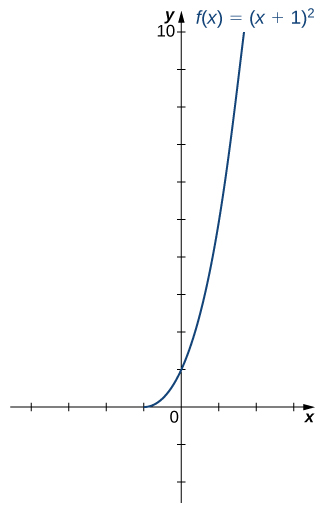
Consider the function  .
.
- Sketch the graph of and use the horizontal line test to show that is not one-to-one.
- Show that is one-to-one on the restricted domain
 . Determine the domain and range for the inverse of on this restricted domain and find a formula for .
Solution
- The graph of is the graph of shifted left 1 unit. Since there exists a horizontal line intersecting the graph more than once, is not one-to-one.
- On the interval
 is one-to-one.
The domain and range of are given by the range and domain of , respectively. Therefore, the domain of is and the range of is . To find a formula for , solve the equation  for . If , then
  . Since we are restricting the domain to the interval where
  , we need
  . Therefore,
  . Interchanging and , we write
  and conclude that
  .
.
Consider  restricted to the domain
  . Verify that is one-to-one on this domain. Determine the domain and range of the inverse of and find a formula for .
Solution
The domain of is  . The range of is . The inverse function is given by the formula
  .
.
Hint
The domain and range of is given by the range and domain of , respectively. To find , solve  for .
for .
Inverse Trigonometric Functions
The six basic trigonometric functions are periodic, and therefore they are not one-to-one. However, if we restrict the domain of a trigonometric function to an interval where it is one-to-one, we can define its inverse. Consider the sine function ((Figure)). The sine function is one-to-one on an infinite number of intervals, but the standard convention is to restrict the domain to the interval ![[-\frac{\pi}{2},\frac{\pi}{2}]](https://ecampusontario.pressbooks.pub/app/uploads/quicklatex/quicklatex.com-200c356c859a85ea8ae96ed8590dfed3_l3.png "Rendered by QuickLaTeX.com") . By doing so, we define the inverse sine function on the domain
. By doing so, we define the inverse sine function on the domain ![[-1,1]](https://ecampusontario.pressbooks.pub/app/uploads/quicklatex/quicklatex.com-b91f34c6ba4ee80f73013b8f66c5760a_l3.png "Rendered by QuickLaTeX.com") such that for any in the interval , the inverse sine function tells us which angle
such that for any in the interval , the inverse sine function tells us which angle  in the interval satisfies
  . Similarly, we can restrict the domains of the other trigonometric functions to define inverse trigonometric functions, which are functions that tell us which angle in a certain interval has a specified trigonometric value.
Definition
The inverse sine function, denoted  or arcsin, and the inverse cosine function, denoted
  or arccos, are defined on the domain
  as follows:

The inverse tangent function, denoted  or arctan, and inverse cotangent function, denoted
  or arccot, are defined on the domain
  as follows:

The inverse cosecant function, denoted  or arccsc, and inverse secant function, denoted
  or arcsec, are defined on the domain
  as follows:

To graph the inverse trigonometric functions, we use the graphs of the trigonometric functions restricted to the domains defined earlier and reflect the graphs about the line ((Figure)).
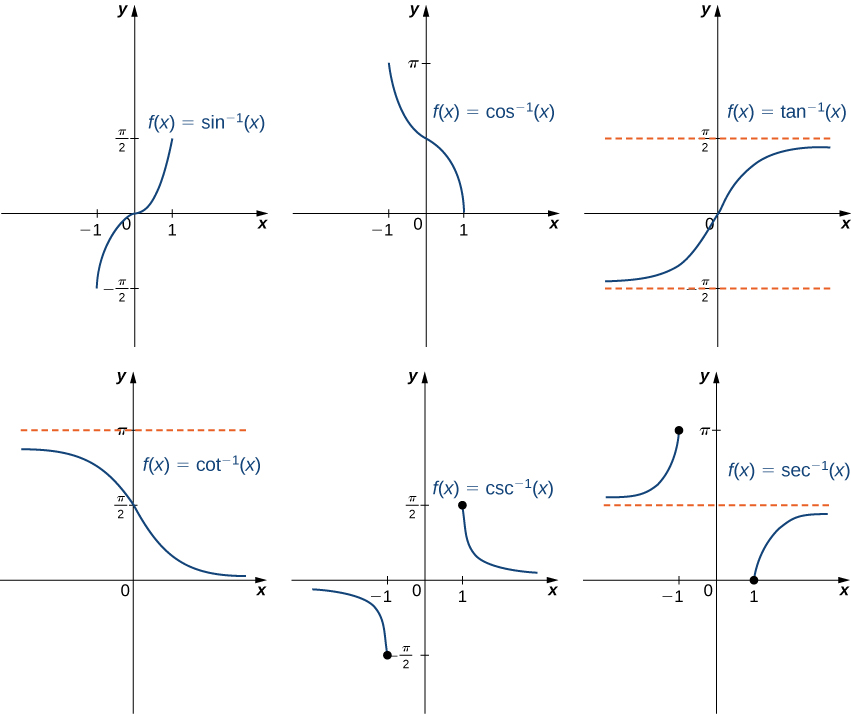 of the corresponding restricted trigonometric function.
Go to the following site for more comparisons of functions and their inverses.
When evaluating an inverse trigonometric function, the output is an angle. For example, to evaluate  , we need to find an angle such that
  . Clearly, many angles have this property. However, given the definition of , we need the angle that not only solves this equation, but also lies in the interval
 ![[0,\pi]](https://ecampusontario.pressbooks.pub/app/uploads/quicklatex/quicklatex.com-ca409902120b1e6a7482ba6b33fedb74_l3.png "Rendered by QuickLaTeX.com") . We conclude that
. We conclude that  .
.
We now consider a composition of a trigonometric function and its inverse. For example, consider the two expressions  and
and  . For the first one, we simplify as follows:
 .
.For the second one, we have
 .
.The inverse function is supposed to “undo” the original function, so why isn’t  ? Recalling our definition of inverse functions, a function and its inverse satisfy the conditions for all in the domain of and for all in the domain of , so what happened here? The issue is that the inverse sine function,
  , is the inverse of the restricted sine function defined on the domain . Therefore, for in the interval , it is true that
  . However, for values of outside this interval, the equation does not hold, even though
  is defined for all real numbers .
What about  ? Does that have a similar issue? The answer is no. Since the domain of is the interval , we conclude that
  if
if  and the expression is not defined for other values of . To summarize,

and
 .
.Similarly, for the cosine function,

and
 .
.Similar properties hold for the other trigonometric functions and their inverses.
Evaluating Expressions Involving Inverse Trigonometric Functions
Evaluate each of the following expressions.


Solution
- Evaluating
 is equivalent to finding the angle such that
  and
and  . The angle
  satisfies these two conditions. Therefore,
  .
. - First we use the fact that
 . Then
  . Therefore,
  .
. - To evaluate
 , first use the fact that
  . Then we need to find the angle such that
  and
and  . Since
  satisfies both these conditions, we have
  .
. - Since
 , we need to evaluate
  . That is, we need to find the angle such that
  and . Since
  satisfies both these conditions, we can conclude that
  .
.
The Maximum Value of a Function
In many areas of science, engineering, and mathematics, it is useful to know the maximum value a function can obtain, even if we don’t know its exact value at a given instant. For instance, if we have a function describing the strength of a roof beam, we would want to know the maximum weight the beam can support without breaking. If we have a function that describes the speed of a train, we would want to know its maximum speed before it jumps off the rails. Safe design often depends on knowing maximum values.
This project describes a simple example of a function with a maximum value that depends on two equation coefficients. We will see that maximum values can depend on several factors other than the independent variable .
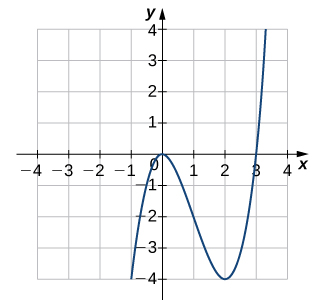
- Consider the graph in (Figure) of the function
 . Describe its overall shape. Is it periodic? How do you know?
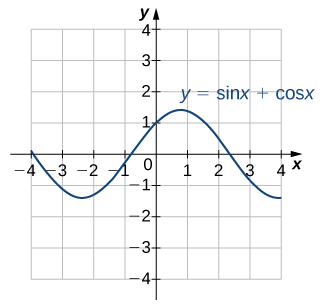
Figure 6. The graph of .Using a graphing calculator or other graphing device, estimate the
– and -values of the maximum point for the graph (the first such point where  ). It may be helpful to express the -value as a multiple of
  .
. - Now consider other graphs of the form
 for various values of
  and
and  . Sketch the graph when
  and
and  , and find the – and -values for the maximum point. (Remember to express the -value as a multiple of , if possible.) Has it moved?
 - Repeat for
 . Is there any relationship to what you found in part (2)?
 - Complete the following table, adding a few choices of your own for and :
0 1 
1 1 0 1 1 1 12 5 1 2 5 12 2 1 2 2 3 4 4 3 - Try to figure out the formula for the -values.
- The formula for the -values is a little harder. The most helpful points from the table are
 . (Hint: Consider inverse trigonometric functions.)
 - If you found formulas for parts (5) and (6), show that they work together. That is, substitute the -value formula you found into and simplify it to arrive at the -value formula you found.
Key Concepts
- For a function to have an inverse, the function must be one-to-one. Given the graph of a function, we can determine whether the function is one-to-one by using the horizontal line test.
- If a function is not one-to-one, we can restrict the domain to a smaller domain where the function is one-to-one and then define the inverse of the function on the smaller domain.
- For a function and its inverse
 for all in the domain of and for all in the domain of .
 - Since the trigonometric functions are periodic, we need to restrict their domains to define the inverse trigonometric functions.
- The graph of a function and its inverse are symmetric about the line .
Key Equations
- Inverse functions
for all in , and for all in .[/latex]
For the following exercises, use the horizontal line test to determine whether each of the given graphs is one-to-one.
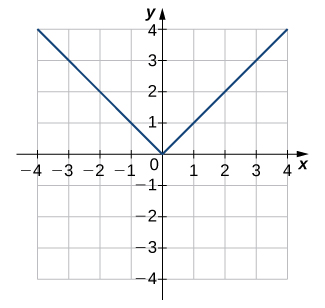
Solution
Not one-to-one
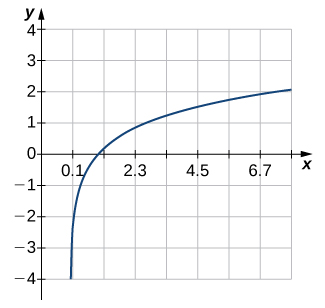
Solution
Not one-to-one
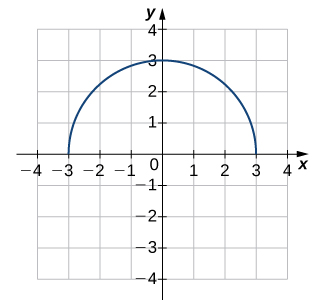
Solution
One-to-one
For the following exercises, a. find the inverse function, and b. find the domain and range of the inverse function.
7. 
Solution
a.  b. Domain:
  , Range:
8. ![f(x)=\sqrt[3]{x-4}](https://ecampusontario.pressbooks.pub/app/uploads/quicklatex/quicklatex.com-62cd9e22654ae0d80d520251cd8aa183_l3.png "Rendered by QuickLaTeX.com")
9. 
Solution
a. ![f^{-1}(x)=\sqrt[3]{x-1}](https://ecampusontario.pressbooks.pub/app/uploads/quicklatex/quicklatex.com-70661234115db338078a470e22cea5ad_l3.png "Rendered by QuickLaTeX.com") b. Domain: all real numbers, Range: all real numbers
b. Domain: all real numbers, Range: all real numbers
10. 
11. 
Solution
a.  , b. Domain:
  , Range:
12. 
For the following exercises, use the graph of to sketch the graph of its inverse function.
Solution
Solution
For the following exercises, use composition to determine which pairs of functions are inverses.
17. 
Solution
These are inverses.
18. 
19. 
Solution
These are not inverses.
20. 
21. 
Solution
These are inverses.
22. 
23. 
Solution
These are inverses.
24. 
For the following exercises, evaluate the functions. Give the exact value.
25. 
Solution

26. 
27. 
Solution

28. 
29. 
Solution
30. 
31. 
Show Answer

32. 
33. 
Solution

34. The function  converts degrees Fahrenheit to degrees Celsius.
- Find the inverse function

- What is the inverse function used for?
35. [T] The velocity  (in centimeters per second) of blood in an artery at a distance cm from the center of the artery can be modeled by the function
  for
for  .
.
- Find
 .
. - Interpret what the inverse function is used for.
- Find the distance from the center of an artery with a velocity of 15 cm/sec, 10 cm/sec, and 5 cm/sec.
Solution
a.  b. The inverse function determines the distance from the center of the artery at which blood is flowing with velocity . c. 0.1 cm; 0.14 cm; 0.17 cm
36. A function that converts dress sizes in the United States to those in Europe is given by  .
.
- Find the European dress sizes that correspond to sizes 6, 8, 10, and 12 in the United States.
- Find the function that converts European dress sizes to U.S. dress sizes.
- Use part b. to find the dress sizes in the United States that correspond to 46, 52, 62, and 70.
37. [T] The cost to remove a toxin from a lake is modeled by the function
 , where
  is the cost (in thousands of dollars) and
  is the amount of toxin in a small lake (measured in parts per billion [ppb]). This model is valid only when the amount of toxin is less than 85 ppb.
- Find the cost to remove 25 ppb, 40 ppb, and 50 ppb of the toxin from the lake.
- Find the inverse function. c. Use part b. to determine how much of the toxin is removed for $50,000.
Solution
a. $31,250, $66,667, $107,143 b.  c. 34 ppb
38. [T] A race car is accelerating at a velocity given by
 ,
,
where  is the velocity (in feet per second) at time
  .
.
- Find the velocity of the car at 10 sec.
- Find the inverse function.
- Use part b. to determine how long it takes for the car to reach a speed of 150 ft/sec.
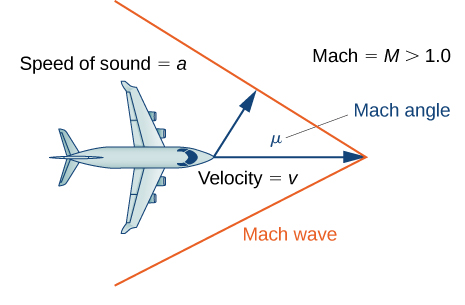
39. [T] An airplane’s Mach number  is the ratio of its speed to the speed of sound. When a plane is flying at a constant altitude, then its Mach angle is given by
  .
.
Find the Mach angle (to the nearest degree) for the following Mach numbers.
 1.0”.”>


Solution
a.  b.
b.  c.
c. 
40. [T] Using , find the Mach number for the following angles.


41. [T] The temperature (in degrees Celsius) of a city in the northern United States can be modeled by the function
![T(x)=5+18 \sin[\frac{\pi}{6}(x-4.6)]](https://ecampusontario.pressbooks.pub/app/uploads/quicklatex/quicklatex.com-4041a2c310297fcd6926bafc6d4f1b11_l3.png "Rendered by QuickLaTeX.com") ,
,
where is time in months and  corresponds to January 1. Determine the month and day when the temperature is
  C.
C.
Solution
 ; so, the temperature occurs on June 21 and August 15
42. [T] The depth (in feet) of water at a dock changes with the rise and fall of tides. It is modeled by the function
 ,
,
where is the number of hours after midnight. Determine the first time after midnight when the depth is 11.75 ft.
43. [T] An object moving in simple harmonic motion is modeled by the function
 ,
,
where  is measured in inches and is measured in seconds. Determine the first time when the distance moved is 4.5 ft.
Solution

44. [T] A local art gallery has a portrait 3 ft in height that is hung 2.5 ft above the eye level of an average person. The viewing angle can be modeled by the function
 ,
,
where is the distance (in feet) from the portrait. Find the viewing angle when a person is 4 ft from the portrait.
45. [T] Use a calculator to evaluate  and
and  . Explain the results of each.
Solution
 ; the expression does not equal 2.1 since
  —in other words, it is not in the restricted domain of
  .
.  , since 2.1 is in the restricted domain of
  .
.
46. [T] Use a calculator to evaluate  and
and  . Explain the results of each.
Glossary
- horizontal line test
- a function is one-to-one if and only if every horizontal line intersects the graph of , at most, once
- inverse function
- for a function , the inverse function satisfies if
- inverse trigonometric functions
- the inverses of the trigonometric functions are defined on restricted domains where they are one-to-one functions
- one-to-one function
- a function is one-to-one if if
- restricted domain
- a subset of the domain of a function

Hint
Use the horizontal line test.