2.4 Operational Risks
Operational risks are associated with day-to-day business operations. These risks can stem from machinery breakdowns, IT system failures, labour disputes, or other internal factors.
A logistics company that relies on a fleet of delivery trucks. If one of the trucks breaks down unexpectedly, it could delay shipments and affect the overall supply chain efficiency.
Categories of Operational Risk

Image Description
A semi-circular diagram representing categories of operational risk, with segments for People (icon of a group of people in a purple segment), Processes (flowchart icon in a yellow segment), Systems (gear icon in a maroon segment), and External Events (arrow pointing outwards icon in a blue segment). At the center is a large gear icon with an exclamation mark, representing the core of operational risk, with each segment connected to the center indicating their contribution to the overall operational risk.
- People: This refers to the risk of financial loss or other negative consequences arising from human error, misconduct, or a lack of skills or experience. Examples of people risk include employee fraud, negligence, turnover, and skills gaps.
- Process: This is the risk of loss arising from poorly designed or implemented business processes. Examples of process risk include errors in data entry, order fulfillment, or product development.
- Systems: This refers to the risk of loss resulting from failures or weaknesses in information technology systems, infrastructure, or other operational systems. Examples of systems risk include hardware or software failures, cyberattacks, and power outages.
- External Events: This is the risk of loss arising from events outside the organization’s control, such as natural disasters, political unrest, or economic downturns.
Operations Risk Indicators
Operational risk indicators, also known as Key Risk Indicators (KRIs), are early warning systems used in risk management to identify potential operational risks before they cause problems. These metrics help assess the likelihood and impact of these risks (Elliott, 2018).

Image Description
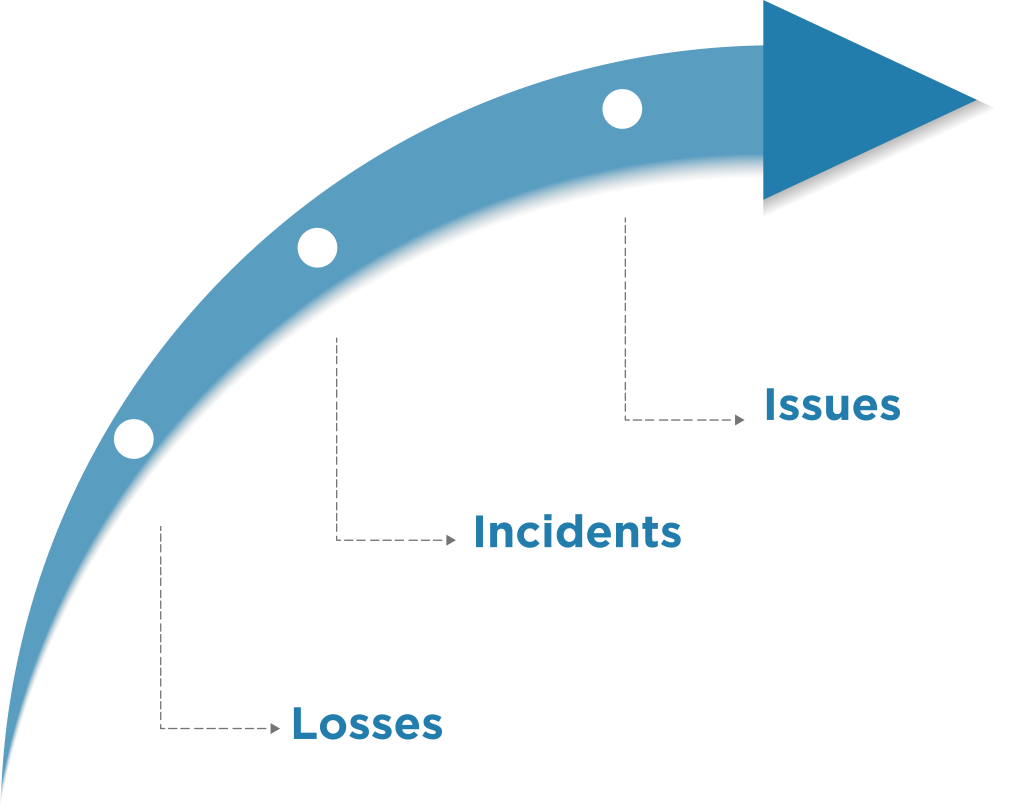
An arrow-shaped diagram showing the progression of issues to losses. The blue arrow curves upwards from the bottom left to the top right, with three white dots along its path. The first dot is labelled “Losses,” with a dashed line pointing to the word. The second dot is labelled “Incidents,” with a dashed line pointing to the word. The third dot is labelled “Issues,” with a dashed line pointing to the word. The diagram illustrates the sequence from losses to incidents and finally to issues.
Key Risk Indicators are the metrics used to measure and define the potential loss. Employee turnover rate, customer complaint volume, and IT system breakdowns are some examples of KRIs. The following examples identify how KRIs identify the potential loss if not addressed.
- Number of customer complaints: Indicates the level of dissatisfaction with products or services.
- Percentage of incomplete or inaccurate transactions: Measures the quality of internal processes.
- Employee turnover rates: Reflects the stability or instability of the workforce.
- Number of system downtime incidents: Highlights technology-related risks.
- Compliance violations: Indicates adherence to regulatory requirements.
KRIs help organizations take action before issues are converted into incidents, eventually resulting in a loss to the organization.

