5 Viewing and Downloading Nearpod Reports
Nearpod generates a report of every student who signs into your lesson, what activities they complete in the lesson (participation %), and what score they achieve in each activity (score %).
You can generate Nearpod reports for the whole session – this report is organized by activity, and shows you a list of what each student responded beneath each activity heading.
You can also generate Nearpod reports for an individual student – this report is reflective of a single student’s participation in the lesson. It gives you their overall participation % and score %, as well as a breakdown of how they responded to each activity.
To view a Nearpod report:
- Go to nearpod.com and log into your account.
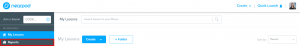
- On the left-side menu, select “Reports”.
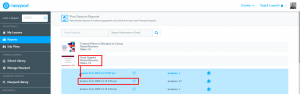
- Click on the lesson that you would like to view reports for and select the launch date of the lesson that you would like to view reports for.
- Pro tip: If you’re launching multiple of the same lesson and want to keep track of them, click the pencil icon to rename each launch!
- Pro tip: If you’re launching multiple of the same lesson and want to keep track of them, click the pencil icon to rename each launch!
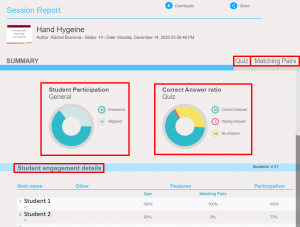
- In the reports pop-up, you’ll be able to see an overview of the lesson and all the students that signed into it. You can also click through the activity tabs to see participation and score percentages for each activity.
- At the top of the reports pop-up, select “Download”. This will give you different download options:
- CSV: Microsoft Excel file
- PDF: read-only document, similar to the look of the reports pop-up
- Session View: gives an overview of the whole session; breaks it down by activity
- Student View: gives an overview of one student’s participation and scores (gives you a class list from which to select the student you would like to see a report for)

- Select the report that you would like to see and it will download for you!
Reports are a great way to see how students are engaging with the content, gauge/grade participation, and hypothesize where students may be struggling.
Also, be aware that in student-paced lessons, students can go back and re-complete activities. This is a great option for knowledge saturation, but could positively skew some of the results. Some students may also log in to view the lesson multiple times, but only do the activities the first time they view the lesson, which could negatively skew some of the results.
The bottom line? Always take the final percentages with a grain of salt.