11.3 Data Types – Qualitative v. Quantitative
![]() Qualitative Data – Any descriptive data that used words (not numbers), to capture feelings and experiences, like the aspect(s) of a program/event a participant enjoyed (or did not enjoy), how the program made them feel, their favourite part of a program, etc. Qualitative data measures the success or failure of a program by capturing participant feelings, thoughts and opinions through written words. As qualitative data measures feelings and opinions, it is regarded as subjective and biased. Qualitative data answers questions like, “Who…?”, “What happened?”, “So what?” and “Now what?”.
Qualitative Data – Any descriptive data that used words (not numbers), to capture feelings and experiences, like the aspect(s) of a program/event a participant enjoyed (or did not enjoy), how the program made them feel, their favourite part of a program, etc. Qualitative data measures the success or failure of a program by capturing participant feelings, thoughts and opinions through written words. As qualitative data measures feelings and opinions, it is regarded as subjective and biased. Qualitative data answers questions like, “Who…?”, “What happened?”, “So what?” and “Now what?”.
Quantitative Data – Any data or information that can be captured, counted or measured in numbers. Quantitative data measures the success or failure of a program by speaking to quantities, numbers, dollars, ratios and scales. As quantitative data measures numbers, it is regarded as objective and unbiased. Quantitative data answers questions like, “When?”, “Where?”, “How much..?” and “How many..?”.
Qualitative Data Collection Tools
1. Narrative Surveys/Questionnaires
- One of the most commonly used methods of collecting summative data for recreation-based programs and events.
- Allow for greater personal expression than quantitative data collection methods, as participants are asked to explain their experiences using descriptive language.
- Ask all participants the same standardized set of questions.
- Are generally more time-consuming to complete than quantitative (numeric) surveys
- Produce rich data as participants are allowed to express their thoughts, feelings, and experiences in their own words.
- Can be administered in different ways: recording answers to the questions verbally (over the phone or through a personal interview), handing a paper copy (and pencil) to each participant to fill out before leaving the program, or linking the participant to an online survey via email.
- Easy to create through platforms like Google Forms or Jotform.
Examples of Qualitative Survey Questions
- What was your favourite activity? Why?
- What was the most fun part of today?
- Tell us about something amazing you learned today:
- What was the highlight of the day?
- What was the lowlight of the day?
- Tell us about our program staff. How did they do?
- If this type of program were offered again, would you attend? Why or why not?
- Tell us how you got to the event today (personal vehicle, taxi, public transit, other):
- If you could add anything to this program, what would it be?
- Did the program meet your expectations? Why or why not?
- What could have been added to the program to make it even more enjoyable?
- Tell us about an aspect of the program that could be improved:
- Would you like your email address added to our mailing list so we can inform you about future programs, promotions and events?
- What else would you like us to know?
**NOTICE how the majority of questions above are “open-ended,” meaning they cannot be answered with a simple YES or NO.
2. Interviews
- Conducting one-on-one or group interviews with program participants after a program has ended can provide rich qualitative feedback and insights.
- Any questions asked in a survey can likely be asked during the interviews, exploring participants’ lived experiences, perceptions, and suggestions for improvement.
- Interviews should be conducted immediately after the end of a program while the information is still fresh.
3. Direct Observation
- Professional direct observation of the program participants can offer valuable qualitative data to discuss after the program has ended.
- Observers (recreation professionals who are NOT the instructors or facilitators) do not participate directly in the program but rather watch and listen. Observers take detailed notes on participant behaviours, interactions, and reactions throughout the program duration, then share their notes and insights into the participant experiences and program dynamics with the instructors after the program has ended
4. Participant Journals
- This form of qualitative data collection asks participants to keep journals or diaries before, during, and/or after a program or event.
- This form of data collection is best suited to programs that run over multiple days, weeks or months.
- Highly reflective in nature, participant journals provide detailed qualitative data about their experiences, emotions, and reflections over time. Data collected in this way offers a longitudinal and deeply personal perspective on a participant’s skill development, personal growth and development and can capture nuances that may be missed with other methods.
Quantitative Data Collection Tools
1. Head Counts (attendance)
- The process of simply counting participant numbers
- Fast and easy way to gather data on engagement
- As a stand-alone method of data collection, this method is weak. Head counts provide no information about participant enjoyment, program impact, hits or misses.
- Head counts can be misleading: big-numbers of participants does not necessarily mean the program was of high quality, and low-numbers of participants is not necessarily an indicator of low quality.
2. Quantitative Surveys
- One of the most commonly used methods of collecting summative data for recreation-based programs and events.
- Participants are asked to rank, rate or grade their experiences using numbers, scales and continuums.
- Ask all participants the same standardized set of questions.
- Are generally less time-consuming to complete than qualitative (word-based) surveys
- Once analyzed, the data produces precise statistics and metrics.
- Can be administered in different ways: handing each participant a paper copy (and pencil) to fill out before leaving the program or linking the participant to an online survey via email.
- Easy to create through platforms like Google Forms or Jotform.
Examples of Quantitative Survey Topics/Data
- Participant age
- Years of experience
- Years of post-secondary education
- Total number of program participants under the age of X years
- Number of people on a waiting list
- Number of dollars generated (program revenue)
- Numeric ratings of various components of a program/event using Likert-type (numeric or ranking) scales
What is a Likert-type scale?
A Likert-type scale is a rating scale used to measure participant satisfaction, dissatisfaction, opinions, likes and dislikes. It consists of a statement or question, followed by a numeric scale (0-5 points, 0-7 points, 0-10 points, etc.) in which a participant can record their answer. Typical 5-point Likert-style scales in recreation-based surveys can ask questions on a variety of criteria, including satisfaction, quality and agreement:
| Satisfaction | Quality | Agreement |
|---|---|---|
|
|
|
Example of a Likert-type scale on a participant survey:
Using the scale below, please answer the following questions:
1 – Very poor 2 – Poor 3 – Acceptable 4 – Good 5 – Very good
- Please rate the overall quality of the XYZ Program.
1 2 3 4 5
- How did you enjoy the evening’s entertainment (jazz trio, DJ)?
1 2 3 4 5
- How do you rate the suitability of the venue for the XYZ Program?
1 2 3 4 5
Other Forms of Quantitative Questions
Not all quantitative questions need to appear in a Likert-type scale format. Other formats include presenting the answer as a binary YES-NO or as an image or emoticon. For example:
1. This event was worth the ticket price (circle one):
Yes No
2. I am leaving today’s program feeling: (circle one):
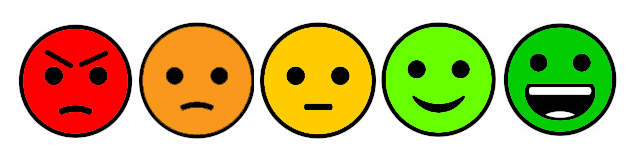
Tips and Tricks on Collecting Data through Surveys/Questionnaires
- Do ask only relevant questions that you want (or need) answered and avoid unnecessary questions that provide little feedback on the quality of your program.
- Do keep program and event surveys short and sweet – aim for 8-10 questions maximum. Few people have the time or desire to fill out a massive survey of 20+ questions.
- Do ensure the wording of your questions is simple and straightforward.
- Do ensure the questions you are asking are suitable to your audience (child, adult).
- Do try for a mix of qualitative and quantitative questions wherever possible.
- Don’t ask biased questions, like “We are known for providing only the most skilled artisans at our craft shows. On the following scale, rate the excellence of the vendors you interacted with today”.
- Don’t use slang, jargon or complex terms that might be lost on your participants.
- Don’t delay getting your survey into the hands of your participants. Each day that passes without surveying the participants = the less they will be willing to fill out a survey, and the more the memory of your program or event will fade.
- FINALLY… aim to collect the data from as many participants as possible within 7-10 days.
The questionnaire evaluation tool does not have to be solely qualitative or quantitative. It can be a mixture of both!
![]()
Example: Mixed Method Questionnaire
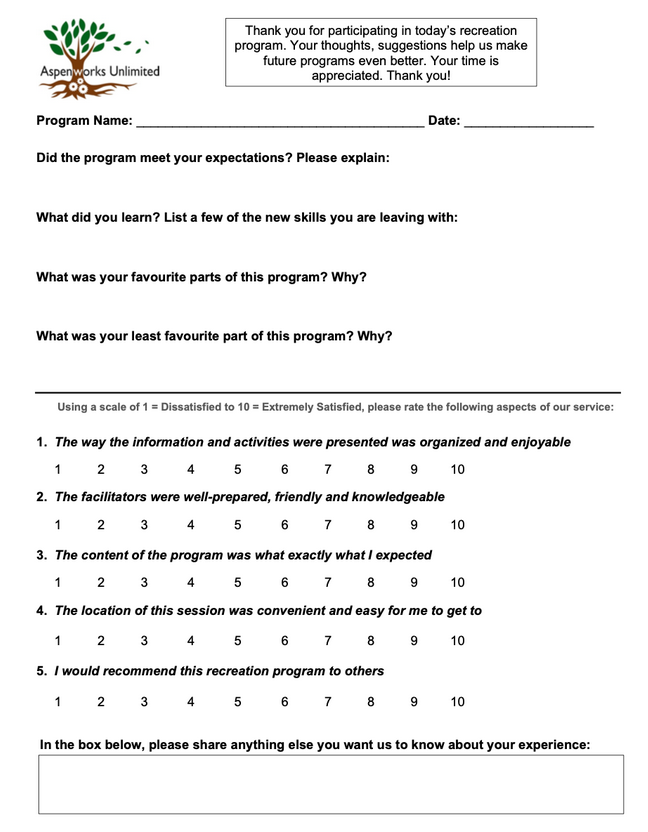
Image Description
Apsenworks Unlimited over logo.
Thank you for participating in today’s recreation program. Your thoughts, suggestions help us make future programs even better. Your time is appreciated. Thank you!
Space to fill in Program Name and Date.
3 sections of questions
- 4 open questions:
- Did the program meet your expectations? Please explain:
- What did you learn? List a few of the new skills you are leaving with:
- What was your favourite part of this program? Why?
- What was your least favourite part of this program? Why?
- 5 Likert scale questions
- Using a scale of 1 = Dissatisfied to 10 = Extremely Satisfied, please rate the following aspects of our service:
- The way the information and activities were presented was organized and enjoyable
- The facilitators were well-prepared, friendly and knowledge
- The content of the program was what exactly what I expected
- The location of this session was convenient and easy for me to get to
- I would recommend this recreation program to others
- Using a scale of 1 = Dissatisfied to 10 = Extremely Satisfied, please rate the following aspects of our service:
- A space for final thoughts:
- In the box below, please share anything else you want us to know about your experience.
OpenAI. (2024, April 26). ChatGPT. [Large language model]. https://chat.openai.com/chat
Methods of collecting qualitative data section was created with ChatGPT using the prompt “List 5 methods of collecting qualitative data after a recreation event.”
