Experiment 7: Carbon Dioxide Absorption
Purpose
The purpose of this experiment is to determine the absorption rate of CO2 in water and its dependence on gas and liquid flow rate. To examine this dependence, an air/CO2 mixture passes in counter-current flow to water in a packed absorption column.
Introduction
Bubbling a gas mixture through a liquid results in soluble components of the mixture dissolving into the liquid. This process can be used to separate soluble components in the gas from insoluble components. The same process occurs in an absorption column where liquid is allowed to trickle down over packing in a column whilst the gas mixture rises up the column. This process can be run continuously. The liquid flowing down and the gas rising up the column intermingle on the packing where absorption occurs. The level of absorption (i.e. the amount of the absorbate that will be absorbed), depends on the flow rates of gas and liquid and on the column design. If the flows are too high, gas and liquid compete for the space in the column; rising gas prevents liquid flowing down and vice-versa. The liquid begins to fill the upper part of the column and gas may force its way out through the U tube blowing the water out of the seal. This condition is known as “flooding” and is avoided in industrial situations. The conditions that lead to “flooding” were investigated in the first part of this experiment, last semester. This experiment focuses on identifying the dependence of absorption on the flow rates of liquid and gas and on the incoming composition of the gas.
Equipment
The absorption column in the lab is a vertical glass pipe about 10 cm in diameter packed with a 140 cm. depth of 8 mm glass Raschig rings to provide good contact between the gas and the liquid. A figure of the column with most major features pointed-out is provided in Figure 1. Gas enters the bottom of the column and leaves at the top through a duct connected to the laboratory fume hood. Water enters the top of the column and leaves at the bottom passing through a tube that remains full of water to prevent gas leaving by this route. Flows of gas and liquid are measured by rotameters. Tappings are available for measuring pressure changes in the system and for taking samples of gas for analysis. A schematic of the flow through the column is provided in Figure 2.
Figure 1: Absorption Column (slightly older photo) with basic functions highlighted
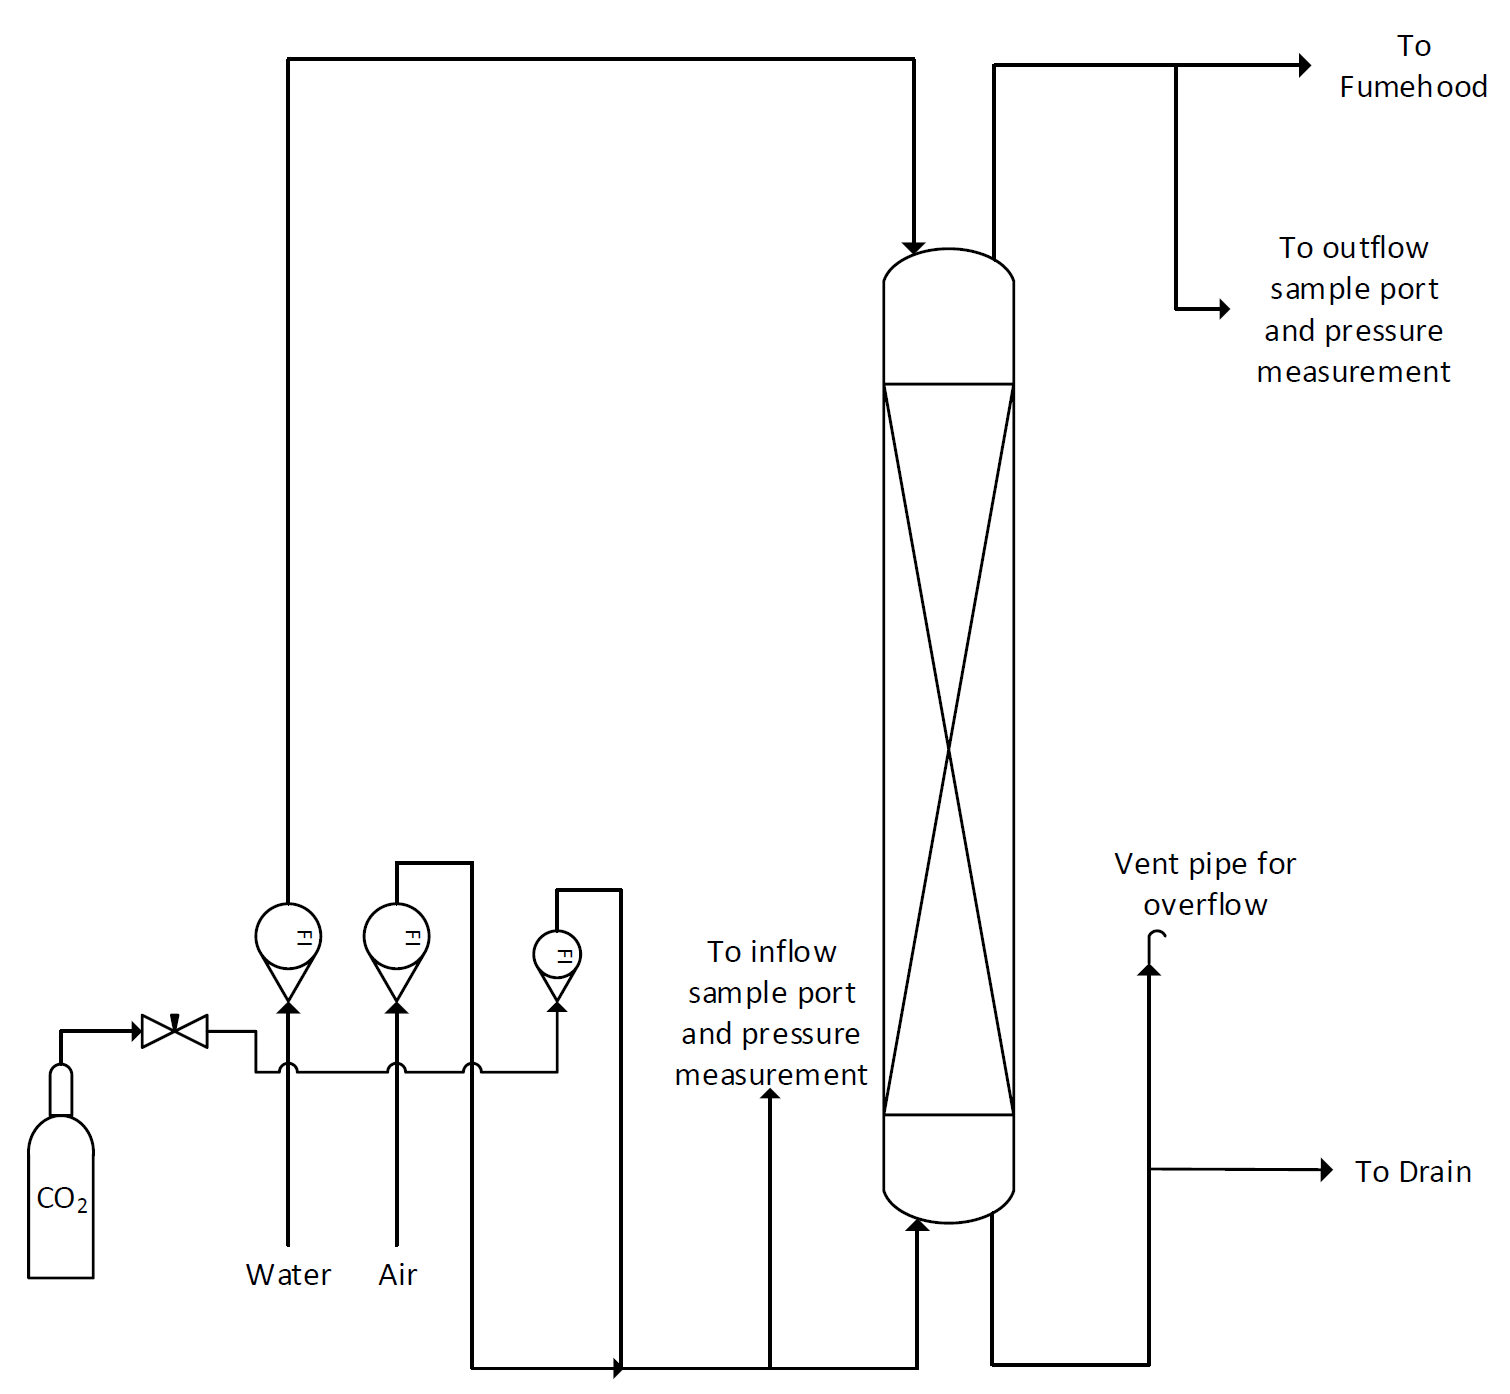
Figure 2: Absorption column P&ID
Raschig rings, similar to the ones provided by this supplier: MilliporeSigma, are just small glass rings added to increase the surface of contact between the gas and the liquid. This is essential, as mass transfer of the dissolving gas component occurs at this interface between the liquid and the gas. In the absence of these rings, the gas would probably rise up the column as a jet, providing little interfacial area and limited absorption. I
At the back of the absorption column, simple tubing with clamps is used to divert the gas coming from the inlet and outlet sampling ports to the differential pressure reader and/or the CO2 analyzer. Figure 3 shows the rear side of the column with all the clamping. The main reason for the piping on the back and the clamps is that any instant in time, only one sample can be fed to the analyzer for CO2% calculation. Hence, there must be a way for the operator to simply exchange between the inflow and the outflow sample for analysis.
Figure 3: Side of Absorption Column with sampling selection valve.
Procedure
The video of the experimental procedure can be seen here: https://www.macvideo.ca/media/PROCTECH+2EC3+-+CO2+Absorption+Experimental+Procedure/1_2eblw6qf
- Set the air flow to 50 SCFH.
- Calibrate the Digital Analyzer to 0% CO2 before turning on the CO2 tank.
- Set the CO2 flow rate so that the inlet gas mixture contains between 7.5 and 12.0% CO2 (readings are in % volume, which for gasses equals % mole). Use the digital analyzer apparatus to check the inlet and outlet CO2 content. Be sure to wait long enough to purge the sampling tube. This is potentially a major source of error. The results of this is a “dry run” should give the same % CO2 for inlet and outlet.
NOTE: To measure the inlet or the outlet sample, the three-way selection valve must be placed at the correct position (point up for sampling from the outlet and down for sampling from the inlet). Refer back to Figure 3 for a photo. - Set a water flow rate to 10 USGPH, wait 5 minutes for steady state to be reached, then measure % CO2 in the outlet gas.
- Vary the water to 20, 30, 40, 60, and 80 USGPH and keep the air and CO2 flow rate constant. After reaching steady state, measure inlet and outlet % CO2.
- Repeat steps 3, 4, and 5 but at higher gas flows (use 100, 150, 200, 250 SCFH). After adjusting the air flow rate, adjust the CO2 flow rate to keep the inlet CO2 in the range of 7.5 to 12.0%.
- End when you have data for at least five different air flow rates.
NOTE: Low flows are unrealistic but flooding must be avoided. Keep that in mind when increasing your water flowrate. Stop if flooding is imminent and move to a higher air flow rate and lower water flow rate.
Report
- For each run calculate the amount of CO2 absorbed (SCFH). Be careful on how you perform the mass balance. Use the following multiple choice question to check your understanding.
- For each gas flowrate plot the amount of CO2 absorbed (in SCFH) vs water flow rate (CO2 absorbed on the y-axis, water on the x-axis). Put all plots on one graph.
- Comment on the shape and trends of the plots.