Experiment 5: pH adjustment
Purpose
- To determine the operating conditions which provide good control in the neutralization of a waste stream.
- To examine the effects of control bandwidth, reagent strength, and reagent pumping rate on the neutralization of a waste stream.
Introduction
The effluent from an industrial process will often contain a diverse array of contaminants and may exhibit a complex set of transient characteristics. For example, the wastewater might be contaminated by heavy metals, oils & greases or solvents, the pH might range anywhere from 0-14, the solution might be a strong oxidant or a reductant. As a result, depending on the specific characteristics of the waste, the effluent might require several different types of treatment: metals removal, BOD control, emulsion breaking, cyanide destruction, etc. In virtually all situations, however, the treatment of industrial effluent will require pH adjustment to near neutral conditions prior to sewer discharge. This unit process is termed NEUTRALIZATION.
Neutralization typically involves the addition of acid and/or base reagents to the wastewater, via chemical feed pumps under the control of a pH Indicator- Controller (pH I/C). The operation is normally executed in a stirred reactor, either on a batch or continuous-flow basis. The pH I/C monitors the pH of the waste solution and, if the level is above or below pre-determined control values, activates the appropriate reagent feed pump. The reagent pump is maintained in an active condition until the target pH level is attained. As such, Neutralization would appear to be a relatively uncomplicated operation and easy to execute. In practice, however, the process is subject to a number of complications:
- Under most conditions, there will be a lag between the addition of a reagent and the response of the pH I/C to this addition. As a result, the pump will continue to operate for a period of time longer than necessary and the volume of reagent injected will exceed the quantity required. In applications where concentrated reagents are used, it is possible that this excess of acid or base will cause the pH to jump beyond the opposite control point. In response, the system will initiate the feed of the other reagent and this might, in turn, cause the pH to move back outside the initial control value. In extreme situations, the system may loop back and forth indefinitely, resulting in excessive reagent consumption and increased equipment wear and tear.
- While the situation described above would tend to argue in favour of the use of dilute reagents, this option may also yield unacceptable results. In continuous flow systems, the residence time in the reactor is the quotient of the tank volume and the solution flow rate:

where
τ = residence time, min.
V = tank volume, m3
Q = flow rate, m3/min
The pH adjustment operation must be fully completed while the slug of effluent is in the reactor and, as a result, the reagent must have sufficient strength to copmlete the pH change within this period of time. Therefore, the optimum reagent strength must be a compromise between these two extremes. - In many industrial applications, the pH of the incoming effluent may be highly variable. For example, the wastewater pH might be 6.4 for several minutes while a specific set of processes are active. Suddenly, a cleaning line might discharge some spent wash water, causing the pH to jump to 11.3. Shortly after this, an acid etch might discharge waste at a pH of 2.6 to the system. The pH control system must be capable of accommodating both the moderate and extreme conditions.
- Most Sewer-use bylaws will allow effluent discharges within a broad range of pH values, typically 6.0 to 10.0. As a result, if the only requirement is compliance with the sewer limits, it may be sufficient to set the pH I/C control points at say 7.0 and 9.0. However, if the neutralization operation is to be followed by some pH-dependent process, such as metals precipitation, it may be necessary to exercise considerably tighter control over the pH range. For copper hydroxide precipitation, for example, the pH should be maintained between pH values of 8.5 and 9.0.
In most situations, it will be necessary to select a pump feed rate (mL/min or USGPH), a reagent concentration, and an acceptable span of control points which will provide the required quality of final discharge, economically and reliably.
Equipment
Figure 1 below show the equipment used in this lab with most critical elements highlighted.
Figure 1: Neutralization experiment setup
- 100 L Continuously-Stirred-Reactor (CSR), complete with mixer.
- pH Indicator-Controller unit, complete with measuring electrode.
- Reagent metering pumps, complete with suction and discharge hoses.
- H2SO4 and NaOH reagents (2% and 5% strength).
- Bucket with tap water.
- 100 mL graduated cylinder.
Procedure
The video of the experimental procedure can be found in this link: Lab Video
- Set the upper and lower control points to 6.0 and 8.0.
To set a control point: Menu → Control → 2 Channel parameters set 1 → Set point → Set the pH using up/down arrows → Press OK → Continue to press ESC key to go to main screen.
Note that it is too easy to maintain control at very high (pH>10) or very low (pH<4) pH settings.
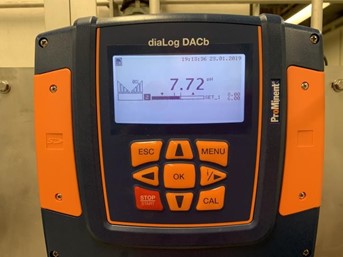
Figure 2: DACb Controller set to pH 6 – 8
- Fill the acid and base reagent container, in the 4.0 L containers provided, of the following concentrations.
- H2SO4 2% and 5%
- NaOH 2% and 5%
During the experiment, the reagents should be used in sets of equivalent strength: e.g. 5% H2SO4 with 5% NaOH, 2% H2SO4 with 2% NaOH.
- Calibrate the acid and base metering pumps:
-
- insert the inlet line into the large bucket of water
- insert the outlet line into the 100 mL graduated cylinder
- set the large dial on the pump face (% stroke length) to 50%
- set the small dial on the pump face (stroke frequency) to 100%.
- run a timer for 3 to 5 minutes and record the volume of water collected in the cylinder; convert this volume and time to a flow rate
- repeat this procedure for a second stroke length or frequency
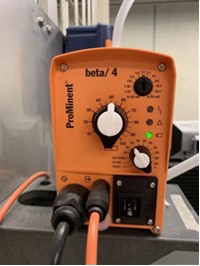
Figure 3: Pump face for calibration
- Fill the tank with tap water (if not already full). The tank should be filled to between 40% and 50%. Start the mixer and adjust to ensure there are relatively turbulent conditions within the reactor.
- Be sure the pH probe is inserted through the lid of the tank and adjust the initial pH to about 5 by adding acid OR a pH of 9 by adding base.
- Use the first set of reagents (2% acid and 2% base), with pump settings, as shown in the Figure below, of:
- 50% stroke length for each reagent and
- the small dial is set to ‘EXTERN’. This setting will cause the pump to work through the controller to add acid or base as needed to reach the desired set point
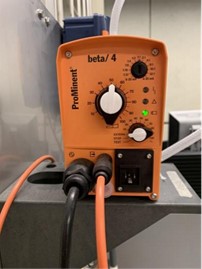
Figure 4: Pump setting for control trials
- Record the pH reading at 10 second intervals until the tank contents have been neutralized (i.e. final pH within desired bandwidth). Note that the tank is neutralized when the pH is within the desired bandwidth and the acid and base pumps have remained off for at least ONE MINUTE.
- If the pumps keep cycling, stop the experiment after a minimum of 5 minutes.
- Repeat steps (6) to (8) but change one variable (i.e., reagent strength, pump stroke length, pH band width) for the second run. Readjust the initial pH as needed to be outside of the desired control limits.
- Repeat step (9) for a total of at least six runs.
- At the end of the experiment stop the process and clean up any spills. Do not empty the contents of the tank unless explicitly asked to do so by the instructor. Return the equipment to the original conditions and locations.
Report
- For each pump, create a plot of volumetric flowrate vs. stroke setting. Use that plot to generate a linear relationship between flowrate and stroke setting. This relationship will be used to convert pump settings to flowrate.
Figure 5 has an example of such a plot with the requested pump relationship.
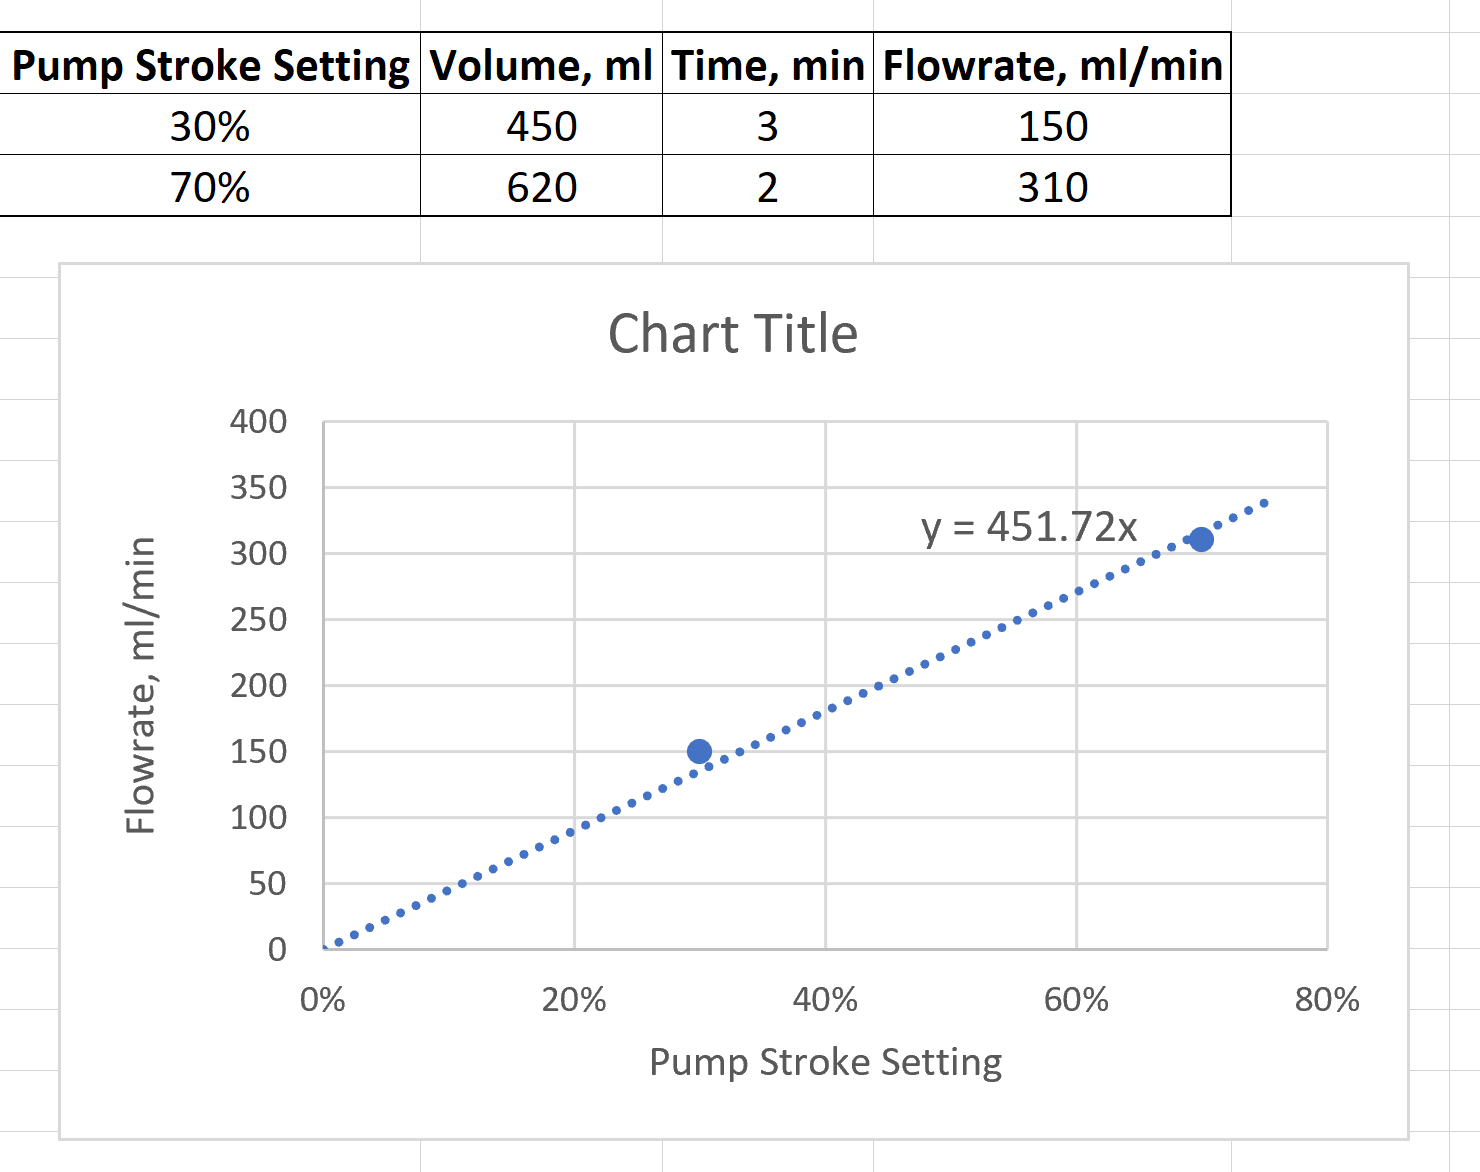 Figure 5: Pump relationship between stroke setting and flowrate.
 - For each run
- prepare a plot of pH versus time
- all runs may be plotted on one graph using different symbols for each trial, or each trial may be plotted on a separate graph
- If runs are plotted on different graphs, ensure that all graphs have the same ranges and unit length on each axis to facilitate comparison.
- Show the pH control points (upper and lower) for each run on the graph through dashed horizontal lines.
- prepare a plot of pH versus time
Figure 6 below has an example of the pH versus time plot for three runs. Note that in the graph provided, the “series” identification is not proper, as the lines must be labeled according to the corresponding stroke, and reagent strength settings. Out of the provided data series, series 1 and 3 lead to a controlled pH, while series 2 does not yield steady state as the pH keeps oscillating between the set points.
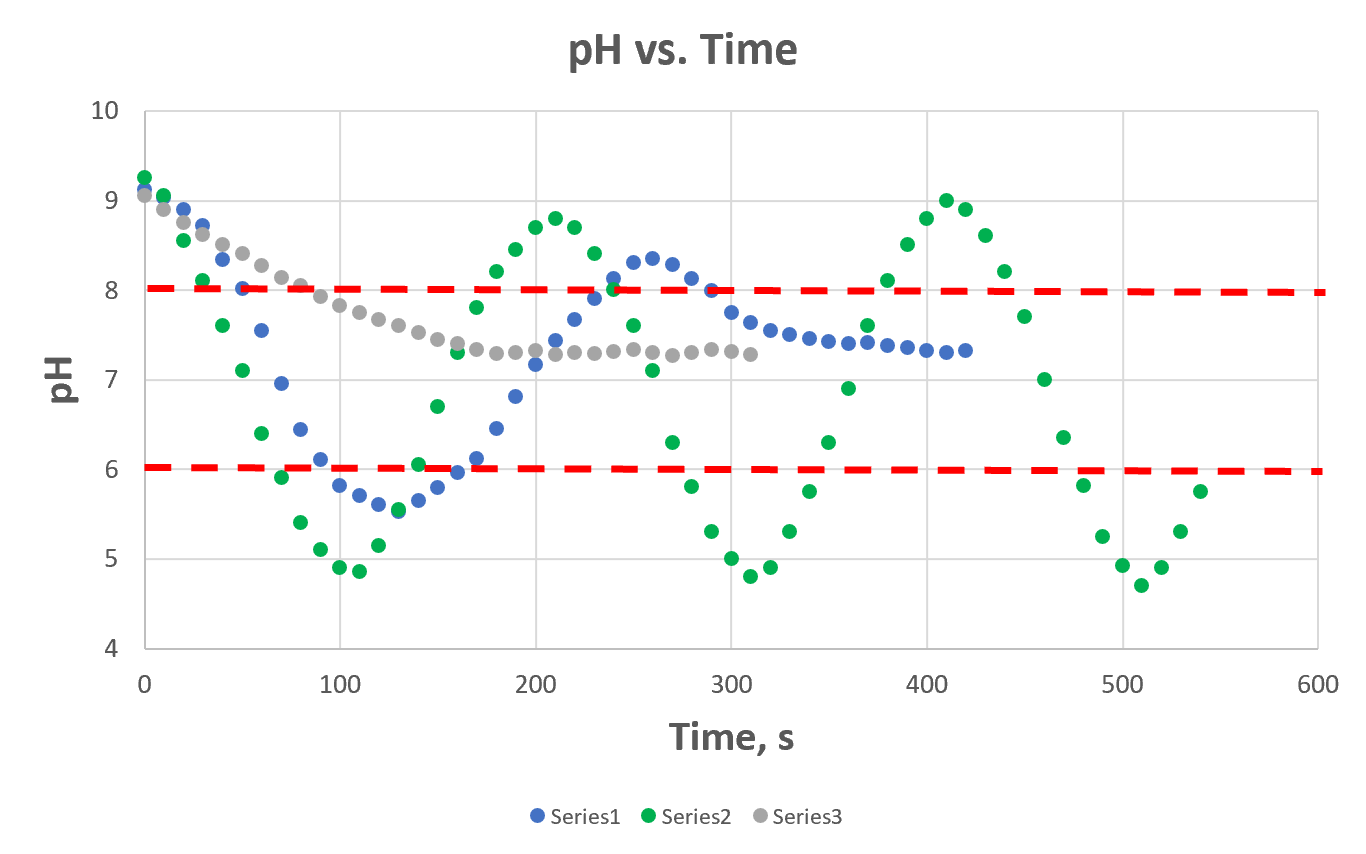
Figure 6: Example of pH versus time graph.
-
- Identify the initial lag time between reagent addition and pH I/C response
- Identify the number of times the system cycled between the upper and lower control points
- Identify the time required to complete the neutralization process.
- Estimate the amount of reagents used by multiplying the time each acid or base pump was operating by its flowrate.
- Based on your trials, identify the optimum conditions for good control; and the approximate length of time taken to complete the neutralization process.
- Comment on the effect of different reagent strengths, with particular reference to:
- difficulties encountered in controlling the reaction,
- the overall costs, in terms of time and money.
Describe some complications that can arise in controlling the pH of industrial wastes.Describe two specific industries where neutralization processes would commonly be used.