Experiment 4: Phosphate Precipitation
Introduction:
Phosphorus is a key nutrient for metabolic activity. However, when present to excess in the natural environment, phosphorus can have a devastating impact on many fragile ecosystems. One of the most visible effects of phosphorous pollution is the eutrophication, or slow death of lakes. During the 1960’s and 1970’s, a phenomenal increase in the growth of algae was observed in many of North America’s water-bodies. The cause of this explosive growth was the high levels of nutrients, particularly nitrogen and phosphorus, in the run-off from agricultural land and in the discharges from sewage systems. As this unsustainable volume of algae died and decayed, however, these lakes and streams experienced extremely serious levels of oxygen depletion and a consequent reduction in aquatic life. Consequently, the control of nitrogen and phosphorus discharges to the environment has become a priority concern of most regulatory authorities.
Phosphorus is a basic component of many fertilizer mixtures and is one of the most effective ingredients in detergents. In industry, phosphates are used as complexing agents in many metal coating processes, such as iron and zinc phosphating operations. As a result, phosphate-bearing industrial discharges will also be contaminated with an assortment of heavy metals, machining fluids, and organic process additives.
Phosphorus can be effectively removed from wastewater by either chemical or biological processes, with the former being the most common approach in industrial applications. The chemical process is based on the precipitation of the phosphorus, as a phosphate, with calcium, iron or aluminum salts.
With the calcium approach, typically based on the use of lime as the calcium source, the precipitate is hydroxyapatite, Ca5OH(PO4)3. The process is pH-dependent, with optimum results in the highly basic (pH = 10-12) range. The calcium phosphate precipitates tend to be very fine particles and, as a result, solids removal may be enhanced by the addition of a coagulant and/or flocculant.
Iron may be added as either a sulphate or as a chloride salt, while aluminum is usually added in the form of sodium aluminate or alum (aluminum sulfate). The amount of trivalent metal required will be a function of pH and the concentration of phosphorus in the effluent. The optimum pH is approximately 5.0 for iron-based processes and 6.0-6.5 where aluminum is used. In both cases, the optimum trivalent metal ion dosage will range from 1.5-3.0 moles of metal (Fe3+ or Al3+) per mole of phosphorus (as P).
Purpose
The purpose of this experiment is:
- To investigate the removal of phosphorus from an effluent stream via chemical precipitation.
- To evaluate the effectiveness of iron for phosphorus removal,
- To assess the influence of pH on the phosphate removal process.
Equipment
Figure 1 displays the equipment used in the E030 lab with its primary functions pointed-out.
Figure 1: Phosphate precipitation apparatus with major components highlighted.
The major components of the experimental setup are:
- A Continuously-Stirred-Reactor (tank) with a mixer and a sampling/draining port
- A pH indicator/probe
- A pH Controller unit with two pumps attached to it
- Containers with H2SO4 and NaOH reagents (their strength is not critical).
Procedure
The video describing the equipment and the experimental procedure can be seen here.
Phosphate Removal and Sampling
- Prepare a tank volume of phosphate effluent. Add approximately 40 Liters of water in the tank. Then contaminate the tank to a level of 100 mg/L of phosphate. There is no pure Phosphate (PO4); so, you need to calculate the required amount of sodium phosphate monohydrate (NaH2PO4∙H2O) to add. Use stoichiometry and attempt the question below for some guidance.
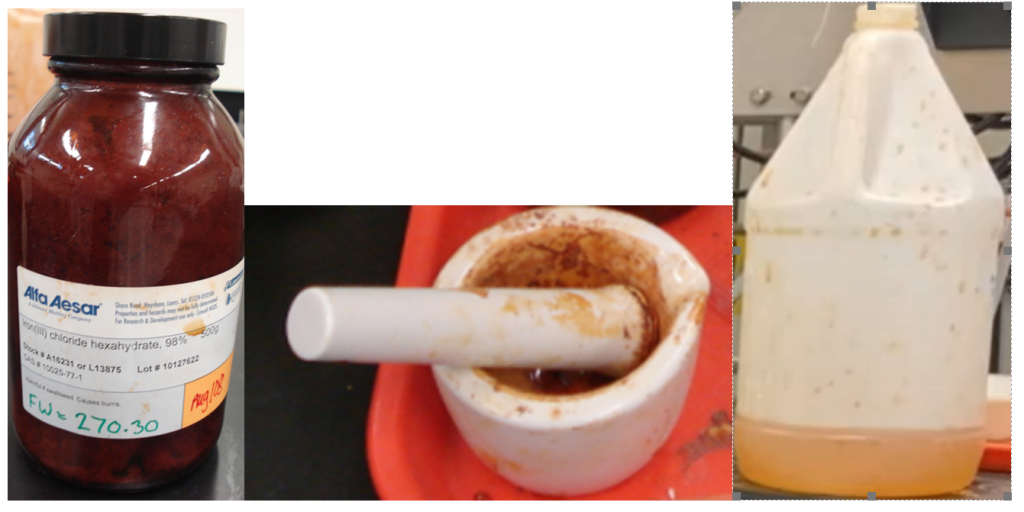
- The coagulating used in this experiment is ferric chloride (FeCl3). However, this does not exit in the lab in pure form, but as hexahydrate: FeCl3∙6(H2O). Calculate the required mass of FeCl3∙6(H2O) given that you need 1.5 moles of FeCl3 for every mole of Phosphate in the tank. Grind the Ferric Chloride first, and then mix it into 1L of water inside the corresponding “orange” container (see below).DO NOT POUR THIS INTO THE TANK!!!!
- Start the tank mixer. Ensure relatively turbulent conditions within the reactor and that all the phosphate is dissolved.
- Set the pH controller set points to 4 (lower set point) and 6 (upper set point).
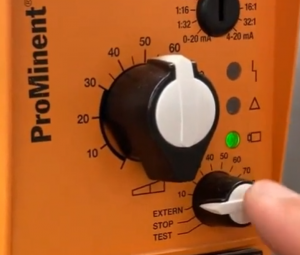
- Ensure that the pumps connected to the controller are feeding from the correct acid or base container and are discharging to the phosphate tank. Also check that the pump is set to “extern” (see image below) to allow the controller to start and stop it as required.
- Start the Controller and monitor the pH to ensure the controller works as required (i.e. it sets the pH within the required range).
- Wait 5 minutes to reach equilibium and then take a sample using the sampling port at the bottom of the tank. To take the sample (and all subsequent samples), fill the container completely, pour the solution back into the tank and then fill it again and keep the sample. Also record the pH at the sampling instant.
- Measure and add 200 mL of the reagent solution (FeCl3) (the one in the orange container) to the tank.
- Wait for 5 minutes and then take another sample and record the pH.
- Repeat steps 8 and 9 until all the reagent is used-up. At this point, you should have a total of 6 samples.
- Adjust the pH set points of the controller to 6 (low limit) and 8 (upper limit).
- Wait for 5 minutes after the pH has settled and then take another sample and record the pH.
- Adjust the pH set points of the controller to 8 and 10.
- Wait for 5 minutes after the pH has settled and then take another sample and record the pH.
- Turn off the controller.
Sample Analysis
The sample analysis can start as soon as 4 samples have been collected. The purpose of the analysis is to determine the concentration of Phosphate (Total Soluble Orthophosphate) remaining dissolved in the solution
- Insert four samples to the centrifuge and centrifuge them as instructed in the lab video. This is done to separate the solids from the solution.
- Because the maximum level of dissolved phosphate that the spectrophotometer can read is 30 mg/L and our original solution has approximately 100 mg/L of phosphate, we need to dilute the samples (if we do not, the readings will be outside the range of the spectrophotometer). Dilute all sampled by a factor of 5, following the procedure described in the lab video. Use the provided cuvettes for the dilution.
- Add the necessary reagents and wait as instructed in the lab video.
- Insert the diluted samples in the spectrophotometer after you first zero the equipment using tap water.
- Record all your readings from the spectrophotometer.
Clean-up
- Clean-up any spills.
- Wash all containers and place to their original positions.
- Connect the hose to the sample/drain valve and empty the tank.
- Rinse the tank.
Report
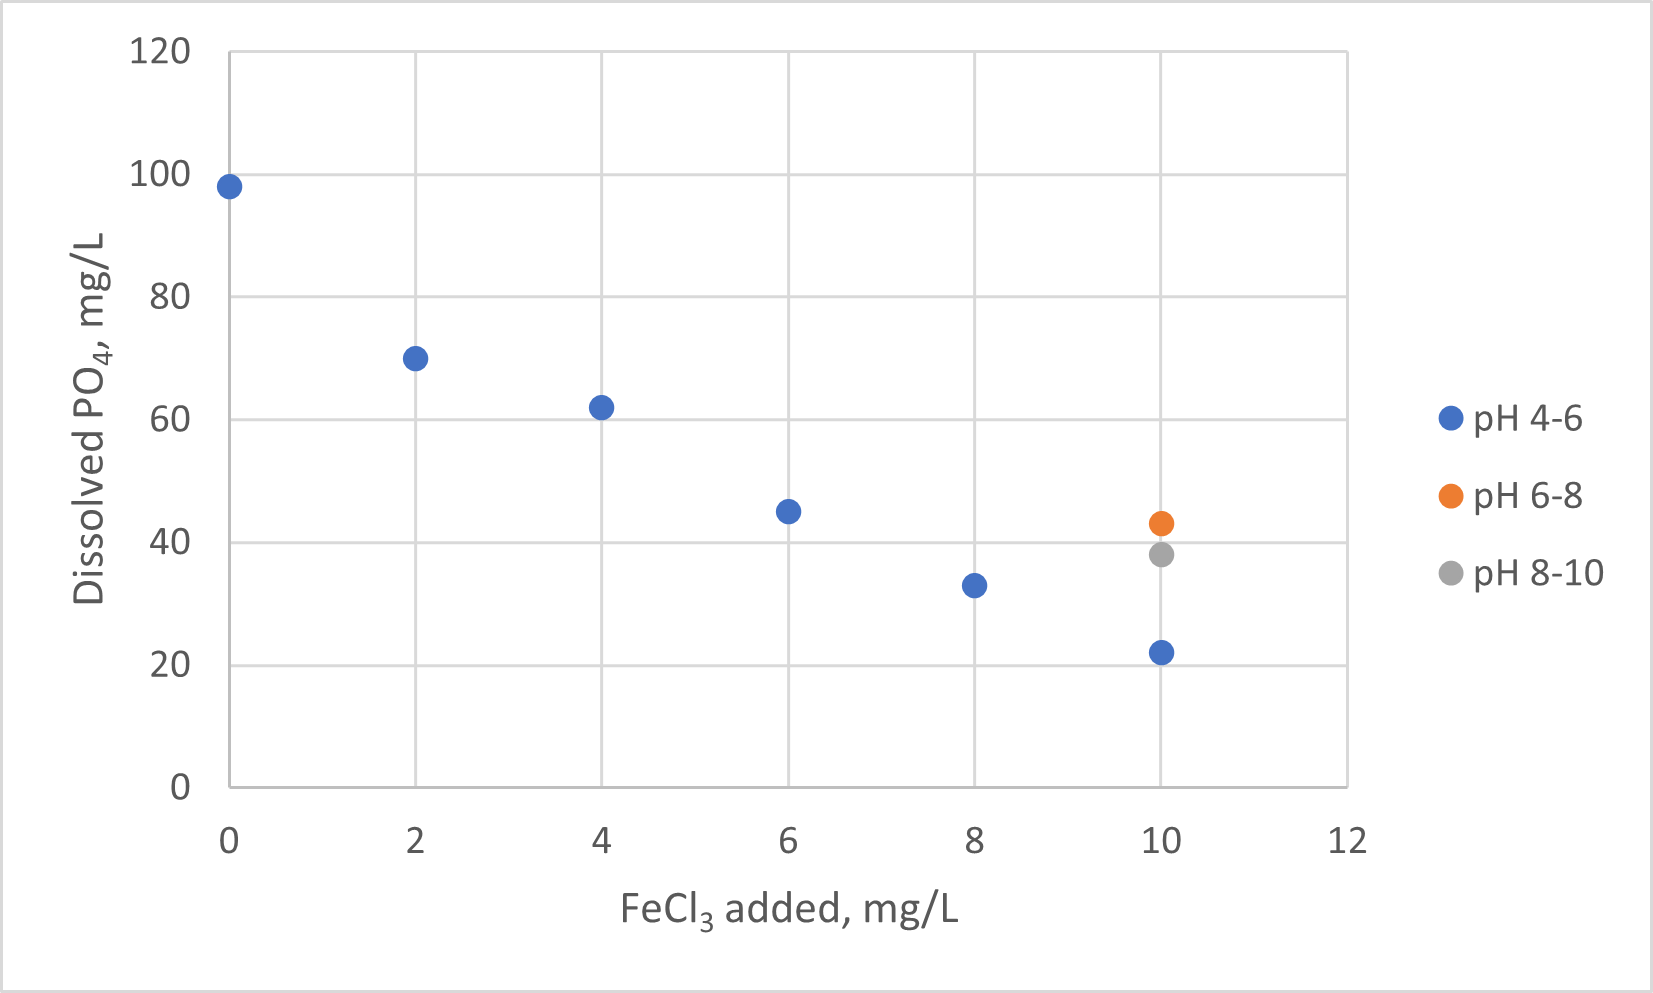
- Tabulate and graph Total Soluble Orthophosphate (mg/L) vs Coagulant Addition (mg/L), for each pH range used in the experiment. A few notes about interpreting the data:
- When interpreting your data, recall that these are measurements on diluted samples.
- The Coagulant addition (x-axis) should be in units of mg FeCl3 per Liter of solution.
- There is only one data point for each of the two “higher” pH ranges.
- A sample graph is provided below
- Discuss the graph (explain the trends).
- Identify the optimum dosage rate for the coagulating agent, in mg/L.
- Identify the optimum pH range for the process.