Experiment 3: Filter Press
Purpose
- To understand the operation of the filter press.
- To filter a slurry of calcium carbonate in water.
- To make visual inspection of the quality of filtration.
- To examine the rate of filtrate collection for different operating pressures.
Introduction
There are many industrial filters corresponding to the funnel-and-paper laboratory filtration apparatus. One type of industrial filter is the plate-and-frame filter press. Figure 1 shows an industrial filter press, while Figure 2 shows a large-scale water filtration press with the “filter cake” (filtered solids) collected on the ground.. The filter press in our laboratory is significantly smaller, but the operating principles are exactly the same.
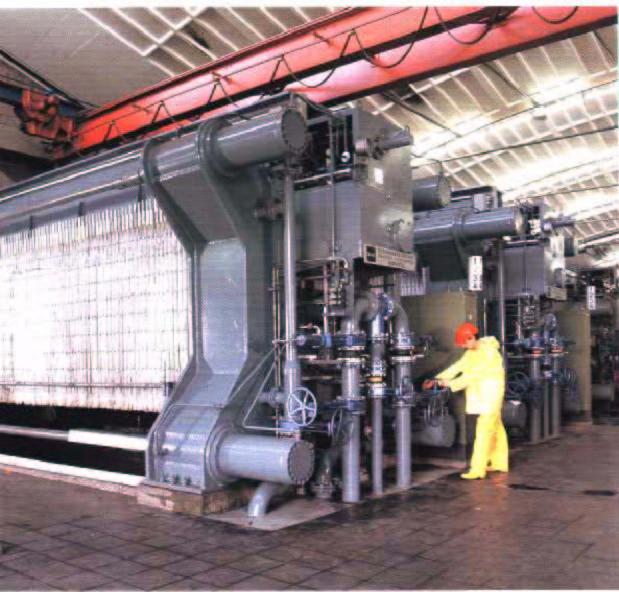
Figure 1: Industrial filter press. Courtesy of ANDRITZ AG
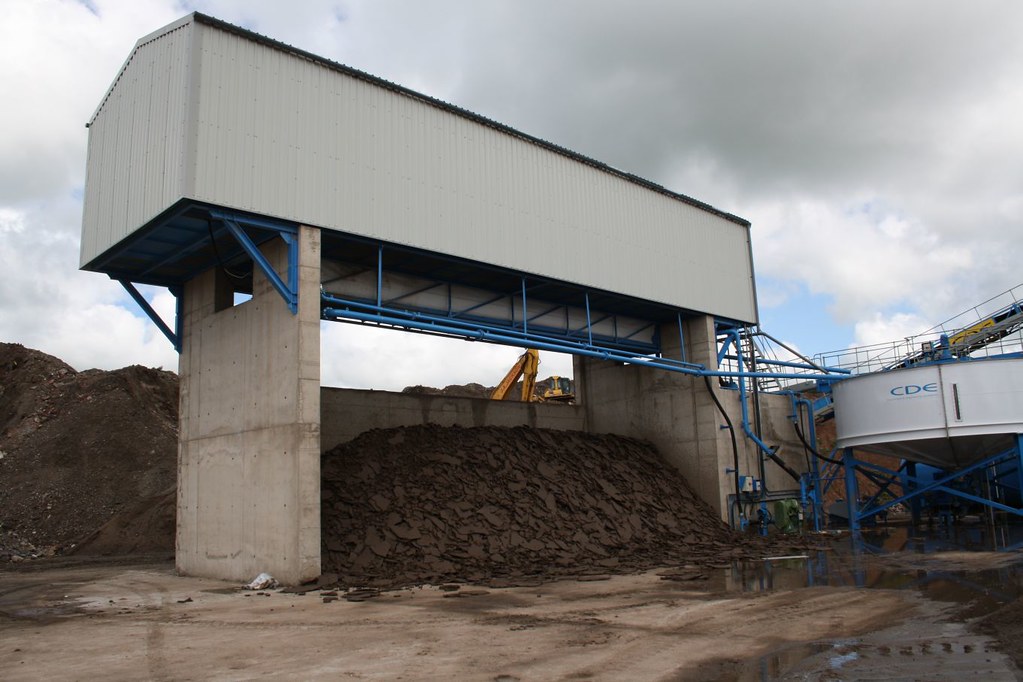
Figure 2: “Filter press enclosure and filter cakes” by CDEGlobal is licensed under CC BY 2.0
The role of the filter press is to separate the solids from the liquid in a slurry. The filter press in our lab has five plates alternating with four frames. Each side of the frames is covered with a filter cloth and the whole assembly is held together by a mechanical screw pressing on the end plate. Holes in plates, frames and cloths must be lined up to form channels for the slurry to enter and the filtrate to leave. The solids in the slurry cannot pass through the cloth and build up inside each frame, eventually filling them with “cake”. At this stage filtration is stopped and the press is dismantled for removal of the cake. Filtration in this case is a batch process.
The following video shows the basic operation of a filter presses.
The next video shows the automated process of removing the filter cake from the press. In this case, the filter press is of slightly different design where the cake is not formed/collected inside a frame but rather within a space between plates. That way, once the plates are moved the cake is free to drop to the ground.
Equipment
The filter press in the E030 lab is a compact one with four frames and five plates. A slurry is forced, by a pump, to run through the filter press. Solid are trapped in the filter cake inside the press while the permeate is return to the slurry container. Figure 3 below provides a schematic of the filter press used in the E030 lab, while Figure 4 provides a photo of the set-up with several key features highlighted.
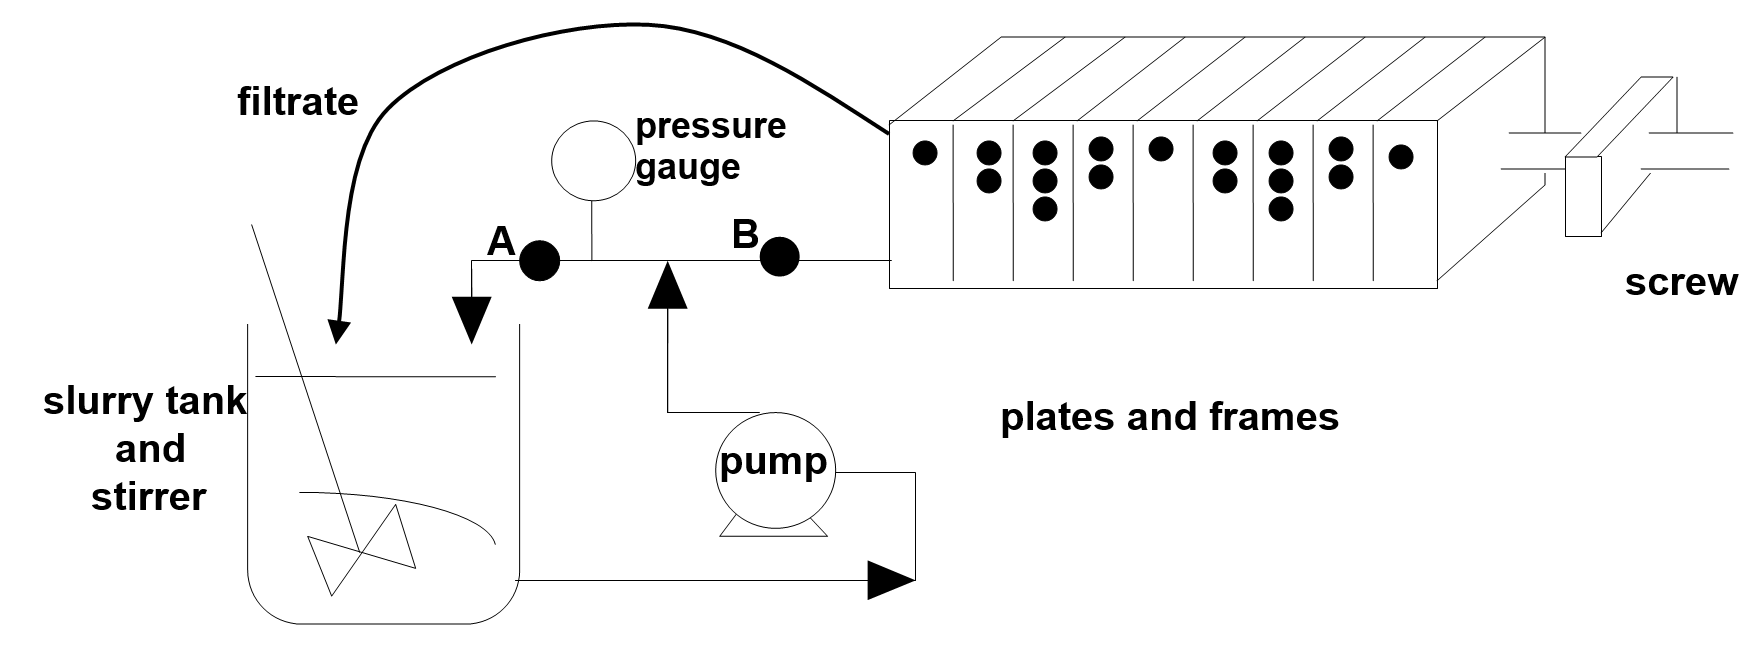
Figure 3: Schematic of filter press in E030.
Figure 4: Filter Press experiment set-up with major components identified.
Procedure
Warning: You might get dirty during this experiment. There is a lot of splashing of CaCO3 (chalk)
The video describing the equipment and the experimental procedure can be seen here.
- Turn on the slurry tank stirrer (it should remain on for the duration of the experiment.)
- Investigate the press assembly. There are small dots on each frame and plate to identify them. The plates and frames should be lined up with the dots facing outwards (towards you) in the order 1-2-3-2-1-2-3-2-1, as shown in Figure 3. Look at the flow channels of each plate and each frame and identify the path the slurry follows at it runs through the press. Think about how are the solids separated from the liquid?
- Assemble the press. The cloths should be over only the hollow frames in an inverted “U”. Take care that the flow holes in the corners of the plates and frames are not covered by filter cloth. Tighten the screw hard.
- Open the by-pass valve A fully and keep the filter press valve B closed. Turn on the pump to make sure it is operating. This is a pneumatic pump; you turn it on using the pressure regulator on the wall behind the filter press. Turn the regulator to set the air pressure to roughly 20 PSI.
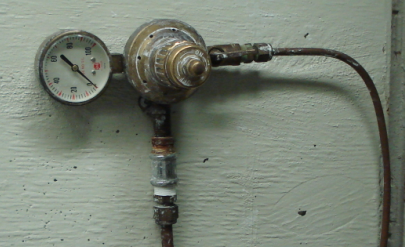 Figure 5: Air regulator for filter press pump
 - Slowly open valve B to let slurry into the filter press. You might need to slightly close valve A to increase the pressure in the press.
NOTE: If there is significant leaking from the filter press, close valve B and try tightening the screw or reducing the slurry pressure by closing valve B and/or opening valve A. - If the press is operating fine, record the maximum pressure in the gauge between valves A and B and start your first run. During the run, you need to record the permeate flow rate over time.
This can be done by collecting the filtrate into a graduated cylinder and recording the amount of total filtrate collected at regular time increments. The recommended way is to record the amount of filtrate collected during the first minute of operation, during the third minute of operation, and so on. Your flow rates should be significant (around 1 liter per minute). All filtrate collected in the graduated cylinder should be returned to the tank.
Let the slurry run for 21 minutes and collect flow rate readings every other minute. You should have collected a total of 11 readings by the end of the run.
NOTE: If the flow rate reduces to a very small value, stop the experiment. - While the press is operating, take, into two identical glass cylinders, one sample from the filtrate and one sample from the slurry. Let the two samples settle (you will come back to them at the end of the experiment).
- At the end of the run, open the press, return all filter cake back to the tank and clean the press (ask your instructor for proper cleaning procedure).
- Perform another run at a different slurry pressure (measure pressure using the gage between valves A and B).
- Disassemble the press. Clean the plates, the frames and the filter papers. Put the frames and plates back into order and hang the filter papers to dry.
- Turn off the stirrer.
- Go back to the two samples collected in step 7. Measure the percentage of solids in each.
- Repeat the experiment at a different (higher) pump pressure.
Report
- Describe the path the slurry follows as it flows through the filter press. How are the solids separated?
- Plot, on the same graph, the filtrate flow rate versus time for all the slurry pressures you have data for. You must create one graph with flowrate on the y-axis and time on the x-axis. There must be on data set and trendline on the graph for each experimental run (i.e. each pump pressure).
- Comment on the shape of the plots on the graph.
- Discuss the effectiveness of the filter press in filtering the solution. Refer to your data form step 12.