3.8 Knowledge Check
 Applying Your Knowledge
Link to the solutions in text format
Text Description
- Ordinal
- Dependent
- Mean
- Independent
- Does not use numbers
- Can not have a mean value
- Involves numerical evaluations
- Uses nominal scales
- Concrete
- Discrete
- Qualitative
- Quantitative
- Variance
- Mean
- Standard Deviation
- Median
- Standard Deviation
- Variance
- Median
- Mean
Applying Your Knowledge
You are a nurse working in the Cancer Centre at Victoria Hospital. You, an attending oncologist, and several other members of the healthcare team have been working with three pharmaceutical companies over the past two years. You are trying to determine which of the company’s drugs for treating a type of non-small cell lung cancer is most successful at reducing patients’ primary tumour diameters.Success in this study is defined as a reduction in tumour diameter. Generally, smaller tumour diameter often indicates that there is less of a chance that a tumour is malignant.
There are 30 subjects in your study – 10 subjects per group. All medication dosages and timing of drug administration has been kept constant across the three drugs. For the graph on the following slide, data were averaged across each participant within their group and then graphed against the 24-month study cycle.
The two years is now over and it is time to look at the results.
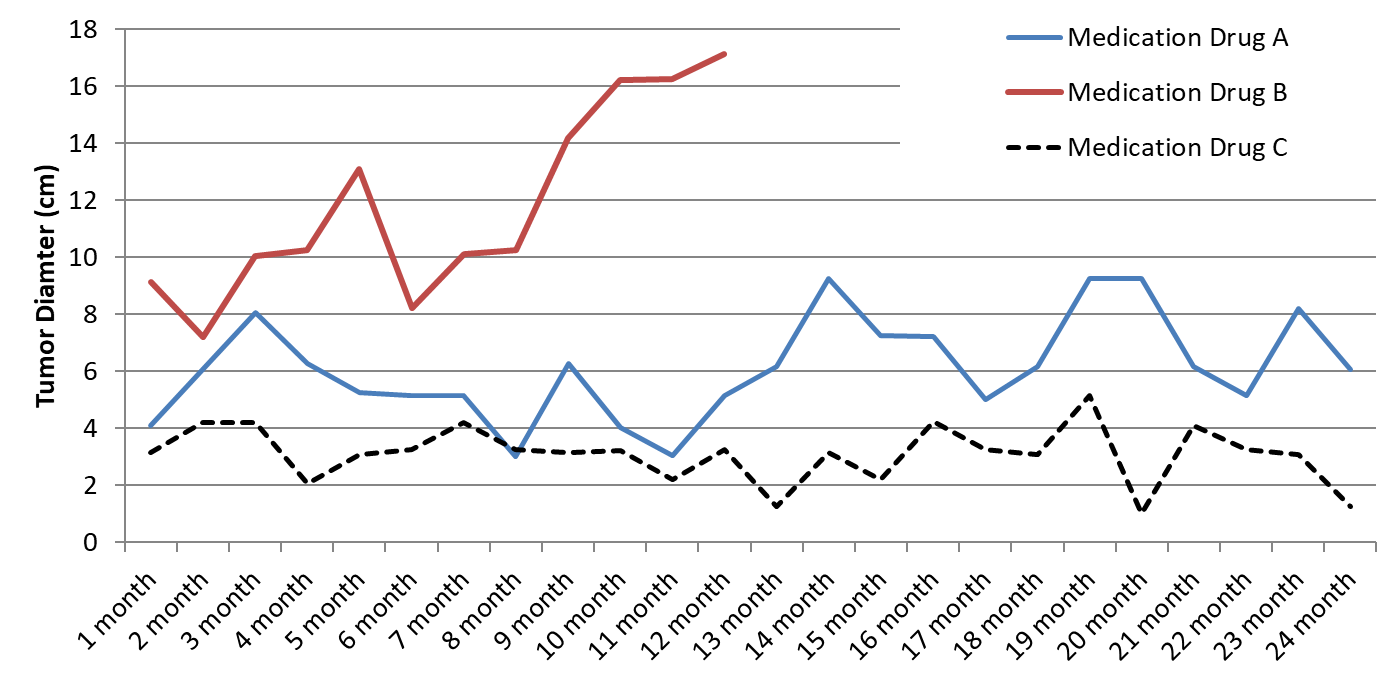
Image Description
Along the x-axis, time in months from 1 month to 24 months
Along the y-axis, Tumor Diameter (cm) from 0cm to 18cm
Line showing Drug A data points (1m, 4cm)(3m, 8cm)(8m, 3cm)(9m, 6cm)(11m, 3cm)(14m 9cm)(16m, 7cm)(17m, 5cm)(18m, 6cm)(19m, 9cm)(20m 9cm)(21m 6cm)(22m, 5cm)(23m, 8cm)(24m, 6cm)
Line showing Drug B data points (1m, 9cm)(2m, 7cm)(3m, 10cm)(4m, 10cm)(5m, 13cm)(6m, 8cm)(7m, 10cm)(8m, 10cm)(10m, 16cm)(10m, 16cm)(11m, 17cm)
Line showing Drug C data points (1m, 3cm)(2m, 4cm)(4m, 2cm)(7m, 4cm)(10m, 2cm)(11m, 3cm)(12m, 1cm)(13m, 3cm)(14m, 2cm)(15m, 4cm)(18m, 5cm)(19m 1cm)(20m, 4cm)(23m, 3cm)(24m, 1cm)
Answer the following questions using graph 1:
- What is the independent variable
- What is the dependent variable
- Since you are wanting to publish your work in various scientific journals across the world, please perform the following conversions.
- Average patient weight loss for subjects taking drug A was 15 kg — ______ lbs
- Average patient weight loss for subjects taking drug B was 22 kg — _______ lbs
- Average patient weight loss for subjects taking drug C was 10 kg — _______ lbs
- Across the three groups, what is the average weight loss = ______kgs and ____lbs
- Describe what you think happened to those taking drug B? Why does the line only go to month 12?
- After assessing the graph, which drug would you recommend now to your future patients and why?
