Gamma Spectroscopy
Introduction
2.1 Radioactive Decay
Unstable radioactive nuclei decay into a more stable state by emitting radiation such as electrons and positrons ( and
and  particles), alpha particles (helium nucleus), neutrinos, and photons (often referred to as gamma rays). These particles are emitted with specific energies that result from exactly how the isotope decays, acting as a fingerprint of sorts. For example, we could consider
  (sodium-22), which has one fewer neutron than the stable isotope of sodium –
  . That missing neutron decreases the binding energy of the nucleus (increasing the total energy), which is why the isotope is unstable: it has more energy than it absolutely needs. In this case, it is energetically favourable for a neutron in the nucleus to decay via the weak force, emit a positron and neutrino, and turn into
  . This process can be written as an equation:
(1) 
where  is a positron and
  is the neutrino. Note that the neon is usually created in an excited state and emits a gamma with about 1275 keV of energy. The positrons annihilate as soon as they hit an electron (and there are lots of electrons around) and generate a pair of gamma rays with 511 keV of energy. One can plot the number of detected gammas as a function of energy to create an energy spectrum plot for a given isotope. The plot for is shown in Figure 1.
Based on the previous paragraph, you might have expected the peaks in Figure 1 to be more like delta functions at the exact energy of the radiated gamma ray. But that would imply that the observer can know the lifetime of the isotope and energy of the decay particle exactly, which would violate Heisenberg’s uncertainty principle (
 ). There are other, less fundamental reasons why the energy is broadened that have to do with the method of measurement and the instruments used. But it is important to know that even in the most ideal experimental setup, we can’t cheat the uncertainty principle.
The broadening of the energy spectrum actually fits a known distribution called the Breit-Wigner distribution (AKA Lorentz distribution, AKA Cauchy distribution, AKA Cauchy-Lorentz distribution). The Breit-Wigner distribution is used to model resonances in high-energy particle physics, atomic transitions,
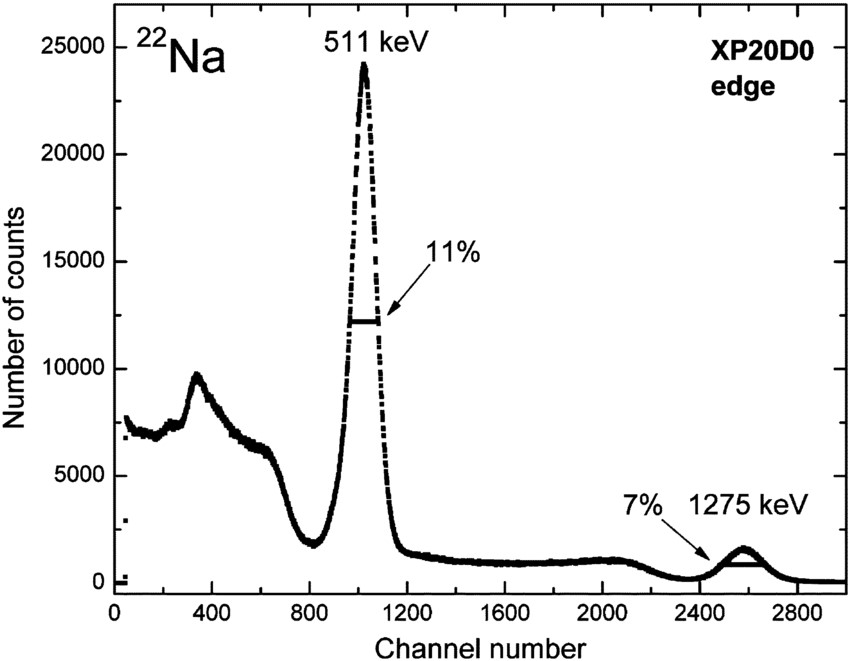
Figure 1: Example spectrum of . The position and relative amplitude of the peaks indicates how the isotope decays and can be used to identify unknown isotopes. Figure from [2]
and radioactive decays. All of these processes involve the transition probability of a resonant state with a known lifetime. The Breit-Wigner distribution is often written as
(2) 
where  is energy of the peak center and
  is the full width at half maximum (FWHM). Note that the width term appears where one would expect for a Gaussian distribution, but also as an amplitude term! We can’t make a resonant peak arbitrarily narrow without causing the amplitude to disappear. Also note that this is the probability-distribution form of the equation. The amplitude term in your fit function will NOT be normalized by the width term! Your fit function will probably look something like
(3) 
where  is an amplitude term and
  accounts for the background not being exactly zero.
2.2 Scintillating Detector
In order to measure the gamma spectrum of a radioactive sample we need to resolve the energy of the gamma rays. If you haven’t already, please watch the recorded lectures on radiation detectors. If you’ve watch that, then you’ll know that something like a Geiger-Mueller tube is not an appropriate detector. We’re going to use a scintillating detector: Specifically, a sodium iodide crystal doped with thallium –  – and a photomultiplier tube.
2.2.1 Scintillating Crystals
Scintillating crystals are named as such because they can convert high-energy gamma rays into lower-energy photons that are closer to the visible spectrum. The NaI crystal has a high density and high atomic number, which means that it is pretty good at stopping gamma rays. Basically, the high-energy gammas transfer their energy to electrons in the crystal via Compton scattering, creating electron-hole pairs, which eventually recombine and emit a lower-energy photon. The key here is that the number of low-energy photons that are generated is proportional to the energy of the incoming gamma. PROPORTIONALITY!!!1! The efficiency of the energy conversion is greatly increased by ‘doping’ with thallium. Basically, these little impurities act as a site where the electron-hole pairs can recombine more easily and thereby release low-energy photons more efficiently.
2.2.2 Photomultiplier Tubes
A photomultiplier tube consists of a photocathode and electron multiplier. A photocathode is basically a just a thin piece of metal that uses the photoelectric effect to convert photons to electrons. The important thing to note here is that each photon that hits the photocathode results in one electron, thereby conserving the proportionality that we need in order to do spectroscopy. Unfortunately, the photon that hits the photocathode results in relatively few electrons; too few to accurately measure. We need a way to increase the magnitude of this electrical pulse while maintaining the proportionality we so desperately need. We need an electron multiplier.
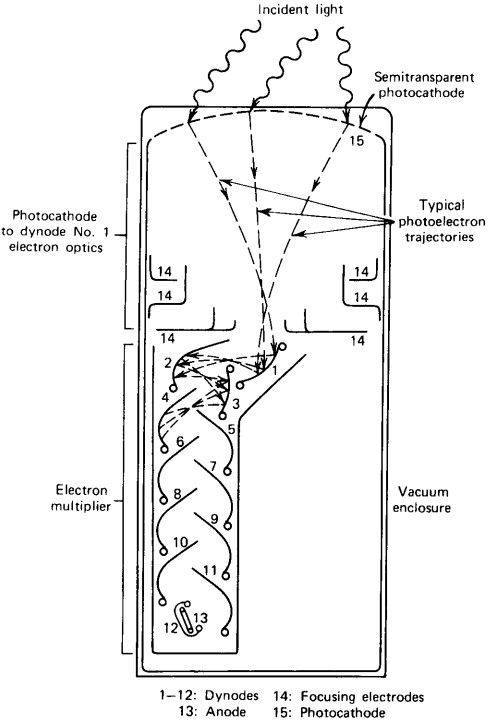
Figure 2: Schematic of a photomultiplier tube. Figure from [1].
The electron multiplier is basically a series of dynodes with increasing electric field. The electric field accelerates the photoelectrons into the next dynode, causing even more electrons to be liberated and accelerated into the next dynode, and so on and so on. See Figure 2 for a rough schematic. The result is an electrical pulse that can be easily measured, the height of which is proportional to the energy of the incoming high-energy gamma ray.
2.2.3 Detector Calibration
We’ve established the height of the measured electrical pulse from the detector is proportional to the energy of the incoming gamma ray. I know that was the last point from the previous section, but it is INCREDIBLY IMPORTANT. With this proportionality, an experimentalist can measure the pulse heights from radioactive sources that emit gamma rays with precisely-known energies and BIN the data – that’s the histograms that you will generate in the lab. With the measured pulse heights and known energies from previouslyidentified isotopes, the detector output can be calibrated i.e. the (pulse height)/(gamma energy) ratio can be determined. The calibration factor can then be used to determine the energy of the incoming gamma rays, which is useful information when attempting to determine an unknown radioactive isotope.
2.3 Features of a Gamma Spectrum
Though gamma spectra are usually unique for each isotope, there are some common features that will mostly depend on the size of the detector and the energy of the gamma rays.
2.3.1 Small Detector
When the detector is small, there is a chance that the high-energy gamma undergoes a single Compton scattering event, depositing a fraction of its energy in the crystal, then escaping with the remainder of its energy. Compton scattering is not a discrete process, and so a broad continuum of energy can potentially be detected, leading to a ‘Compton continuum’, as seen in Figure 3. If the incoming gamma ray has enough energy, it can create positron-electron pairs (AKA ‘pair production’). The electron will deposit all of its energy since the crystal is so dense that the mean-free path of the electron is very small. The positron will definitely annihilate inside the crystal since there are so many electrons around, but the resulting 511-keV photons from the annihilation could potentially escape, leading to a peak in the Compton continuum at an energy of the gamma minus the energy required to make the positron-electron pair (see Figure 3).
2.3.2 Medium Detector
The gamma interactions in a medium-sized detector are shown in Figure 4. In this slightly larger detector, the chance for Compton-scattered gammas to escape is smaller, but non-zero. The resulting Compton continuum would have a smaller amplitude, but still be noticeable. If the incoming gammas have enough energy to create a positron-electron pair, then the resulting gammas from the positron annihilation can both
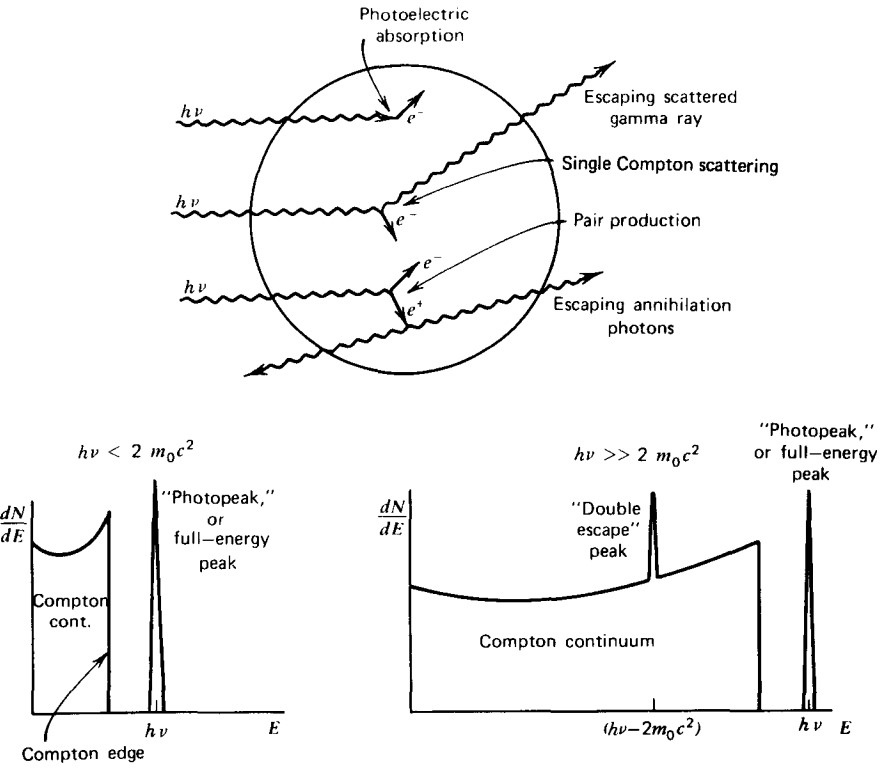
Figure 3: Schematic of gamma rays hitting a small detector and the resulting gamma spectrum. Figure from [1].
escape, or only one can escape while the other deposits its energy into the crystal. Therefore, it’s possible to generate single and double escape peaks in the energy spectrum, as shown in Figure 4.
2.3.3 Large Detector
Large detectors don’t have any interesting features! They are so large that all the energy from all of the incoming gamma rays is deposited into the crystal, and the user only sees the peak due to the full energy of the deposited gamma ray.
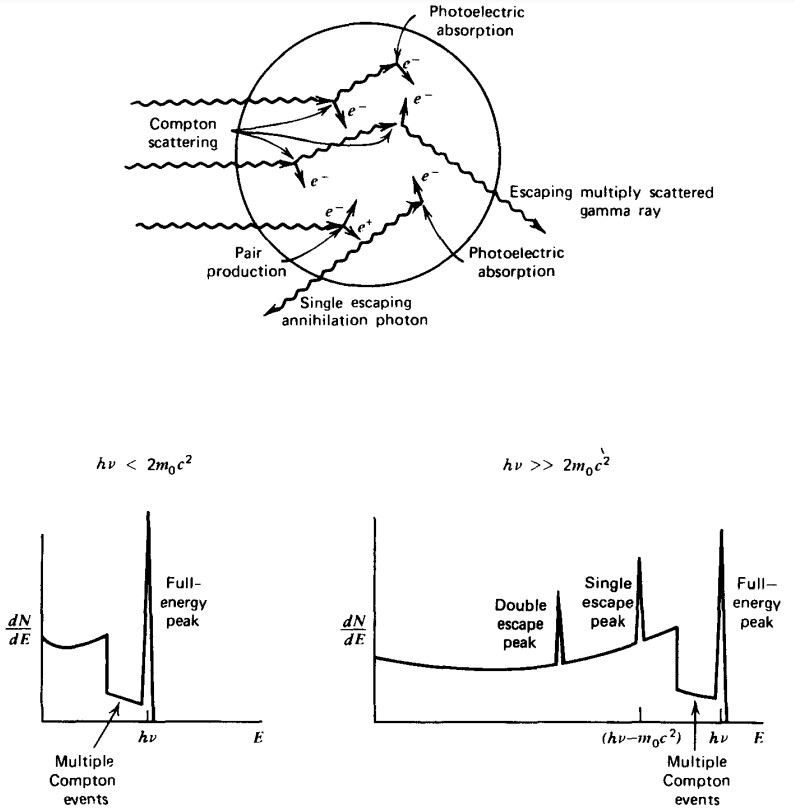
Figure 4: Schematic of gamma rays hitting a medium-sized detector and the resulting gamma spectrum. Figure from [1].