Plasma Physics
Introduction
WARNING: This experiment uses the oscilloscope. A LOT. Please watch the recorded lecture on how to use an oscilloscope before you attempt this lab.
Plasmas are often referred to as the fourth state of matter, since they have properties that differ wildly from solids, liquids, and gases. Plasmas are often produced by ionizing gases but, unlike a gas, a plasma has very high electrical conductivity, and is made of up independently acting species, leading to various properties that make plasmas unique.
Plasmas exist in a wide range of pressure and temperatures; neon signs, compact fluorescent lamps (CFLs), lightening, and the Sun are all examples of plasmas. Plasmas have found a wide variety of applications, such as in fusion energy production, semiconductor etching and sputtering, and the emerging field of plasma health care.
2.1 DC Glow Discharge
The plasma you will be studying is generated in a DC glow discharge tube, an example of which is shown schematically in Figure 1. A large electric field is created by applying a large potential difference between the anode and cathode. Atoms in the electric field may be hit by cosmic rays, which ionize the atom making a negatively-charged electron and positively charged ion. The ions are accelerated by the electric field, and can gain enough energy to ionize other atoms upon collision. This process happens repeatedly, called a Townsend avalanche, generating a light glow. With a large enough electric field, the positively-charged ions that hit the anode will eject electrons from the anode surface. These electrons are accelerated in the electric field, ionizing more atoms and so on and so on. At this point, the plasma takes on the characteristic pattern shown in Figure 1.
2.2 Qualitative plasma parameters
The plasma in Figure 1 has several features that are difficult to precisely measure, but still provide insights into the physics of the plasma. We’ll look at the plasma from left to right as it will appear in the lab apparatus, which means that the cathode is on the left and the anode is on the right. The positive ions that hit the cathode liberate electrons with only about 1 eV (electron-volt) of energy. These electrons don’t have enough energy to even excite the gas atoms, never mind ionize them, which leads to a dark area beside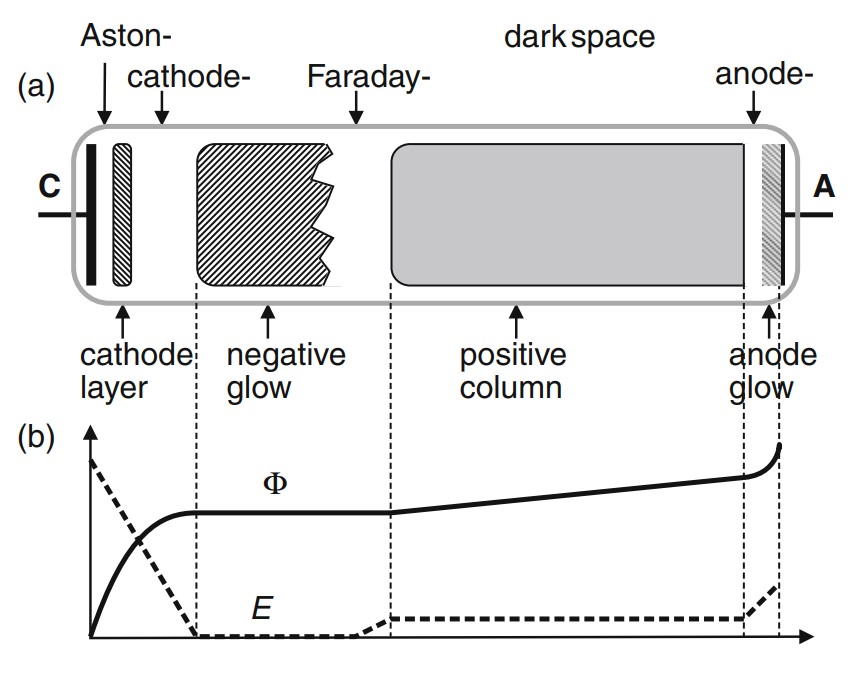
Figure 1: (a) A schematic of a stable DC discharge plasma. The various regions of the plasma are explained in the text. (b) The electric field (E), and the electric potential ( ) over the length between the anode and cathode. Figure from reference [2]
the cathode (the Aston dark space). Farther to the right, the electrons have gained enough energy from the electric field to excite the gas atoms, leading to a glowing region. As the electrons gain more energy, they ionize the gas atoms, producing electrons and ions. The electric field separates the electrons and ions so that they don’t recombine, and, therefore, don’t emit light, leading to another dark space. The electrons that result from that ionization quickly accelerate in the electric field and reach a high enough energy to excite gas atoms and create a very bright glow, called the ‘negative glow’. To the right of this negative glow region, the electric field is at a minimum, and the electrons cannot gain enough energy to excite new gas atoms, leading to a large dark space called the Faraday dark space. To the right of the Faraday dark space, the electric field begins to increase again, accelerating the electrons, and leading to another bright section called the positive column (since it is nearer to the anode). The positive column often exhibits striations, which are due to the discretization of the atomic energy levels in the gas. And much like the cathode, the anode has a glow and dark region.
These features change with the applied discharge current, pressure, and gas species, and can be used to qualitatively study atomic energy levels.
2.3 Quantitative Plasma Parameters
The DC glow discharge can be measured quantitively to determine specific plasma parameters such as the plasma temperature, density, and floating potential. To measure these values, we need a tool that can sample the electrons in the plasma, called a Langmuir probe. The probe is simple; it’s just a bit of wire with a bit of insulator to help precisely define the amount of conductor that’s exposed to the plasma.

Figure 2: An example of a current-voltage (IV) curve generated with the kind of plasma used in this experiment. Region 1 corresponds to the ion saturation region, Region 3 corresponds to the electron saturation region, and Region 2 corresponds to exponential current growth due to the Maxwell-Boltzmann distribution of electron energy.
2.4 Langmuir Probe Theory
The Langmuir probe used in this experiment is nothing more than a bare wire inserted into the plasma. A sweeping bias is applied to the wire, which affects the current measured by the wire due to ions or electrons being attracted to, and colliding with, the wire. The characteristics of the current-voltage curve can be used to determine many useful plasma parameters.
An example of an IV curve is shown in Figure 2. In order to appreciate the features of this curve, one must understand what is happening at the boundary between the plasma and the probe. Starting at the left of the plot (Region 1), the probe has a large, negative bias, thereby attracting ions and repelling electrons. A conceptualization of what’s happening at the probe is shown in Figure 3. The difference between the probe potential and the plasma potential results in a ‘sheath’ region that extends into the plasma. The negative probe bias attracts ions while repelling electrons unless they have enough thermal energy to cross the potential barrier.
Figure 4 shows the opposite situation (Region 3 in Figure 2), where the large positive bias on the probe attracts electrons and repels ions. Ions with enough thermal energy to cross the potential barrier will strike the probe.
As the probe potential grows very negative or very positive (the far ends of Region 1 or 3 in Figure 2), the resulting ion or electron current grows slowly as the sheath region extends into the plasma, attracting slightly more ions or electrons.
It was once thought that the plasma space potential (noted  ), which is the average potential within the plasma, could be measured by inserting the probe into the plasma and measuring the floating potential of the wire. This technique results in measurement of the floating potential (
 ), which is the potential the probe reaches in order to balance the number of electrons and ions hitting the surface of the probe.

Figure 3: At large, negative probe potentials, the ions are attracted to the probe while the electrons are repelled. Only electrons with enough thermal energy to overcome the potential barrier can hit the probe and generate current.
As shown in the IV curve analysis above, the electron current to the probe grows exponentially when the probe voltage ( ) is between and (Region 2 in Figure 2). Exponential behaviour is expected since the electron velocities obey a Maxwell-Boltzmann distribution; as the probe voltage becomes more positive, exponentially more electrons have enough velocity to overcome the potential barrier. When is greater than , the electron current grows slowly as the sheath around the probe grows larger, thereby preferentially preventing ions from striking the probe. Therefore, the plasma space potential occurs at the inflection point between these two domains (the shaded section between Region 2 and 3 in Figure 2).
2.5 Langmuir Probe Measurements
It is assumed that the electrons in the plasma are in thermal equilibrium, and, thus, their velocity distribution is a Maxwell-Boltzmann distribution:
(1) ![\begin{equation*} f(v) = n_e\left(\cfrac{m_e}{2\pi T_e}\right) ^{\cfrac{1}{2}}\exp[-\cfrac{m_ev^2}{2T_e}],\end{equation*}](https://ecampusontario.pressbooks.pub/app/uploads/quicklatex/quicklatex.com-7f4f0a099c26cdd181e9db1696e900af_l3.png "Rendered by QuickLaTeX.com")
where  is the electron density,
  is the electron mass,
  is the electron temperature in units of eV, and
  is the electron velocity. The single-dimension distribution function is used since the electron flux entering the sheath depends only on the radial dimension.
The assumption of a Maxwellian distribution is a powerful (and accurate) one. This assumption allows one to presume that the probe current in Region 2 in Figure 2 is an exponential increase, with the form
(2) ![\begin{equation*} I_e = I_{es}\exp[-e(V_{sp}-V_p)/T_e],\end{equation*}](https://ecampusontario.pressbooks.pub/app/uploads/quicklatex/quicklatex.com-01b78321aa00f9cc07f35630077d9642_l3.png "Rendered by QuickLaTeX.com")
where  is the saturated electron current,
  is the probe voltage where
  , and
, and  is the surface area of the probe.

Figure 4: At large, positive probe potentials, the electrons are attracted to the probe while the ions are repelled. Only ions with enough thermal energy to overcome the potential barrier can hit the probe and generate current.
Taking the natural logarithm of Equation (2) gives
(3) 
Therefore, the thermal energy of the plasma is given by the inverse-slope of the semi-log plot of the IV curve in Region 2 in Figure 2.
The value of the saturation current in Region 3 of Figure 2 is used to determine the electron density with the now-known value of .
Finally, the plasma potential is determined at the inflection point between Regions 2 and 3 in Figure 2. It is rare that one will see a sharp edge between these regions, therefore, the intersection between the fits of these regions is used to determine the space potential of the plasma.