Thermal Conductivity of Gases
Experimental Apparatus
3.1 Vacuum Chamber & Gas Valves
The apparatus used to measure the thermal conductivity of gases is shown in Figure 1. The bell jar is evacuated by the rotary vane vacuum pump located under the bell jar. The bell jar is filled with air or alternate gases using the gas selection valves behind the bell jar. Pressure in the bell jar can be monitored using the Bourdon gauge, or by watching the meter for the convectron gauge. Note that thermal conductivity of a gas doesn’t vary with pressure very much near atmospheric pressure. Using even half an atmosphere of pressure will get approximately the same result.

Figure 1: The apparatus used to measure thermal conductivity of gases. The two cylinders are located in the bell jar assembly
Some notes of caution when using the apparatus:
- The valve above the vacuum pump should not be opened unless the vacuum pump is on.
- Never open the gas inlet valve and the valve above the vacuum pump at the same time. It is an efficient way to empty our gas cylinders.
- Talk with the TA or lab tech before you use gas from the cylinders. We need to coordinate with other groups that are using the gas. Only TAs and technicians are allowed to operate the gas cylinders.
- The pressure reading from the convectron gauge is gas dependent. When using gases other than air, look to the Bourdon gauge located left of the bell jar to measure pressure.
- Do not over-pressurize the bell jar.
3.2 Cylinders
Two cylinders (shown in Figure 2) are mounted concentrically in the bell jar. A resistive heater is attached to the inner cylinder. When current passes through the heater, the inner cylinder increases in temperature. Thermocouples are attached to both cylinders and the DIFFERENCE in temperature is output to the data acquisition software. Once the system reaches thermal equilibrium for a given current to the heater, the difference in temperature between the cylinders can be used to determine the thermal conductivity of the gas.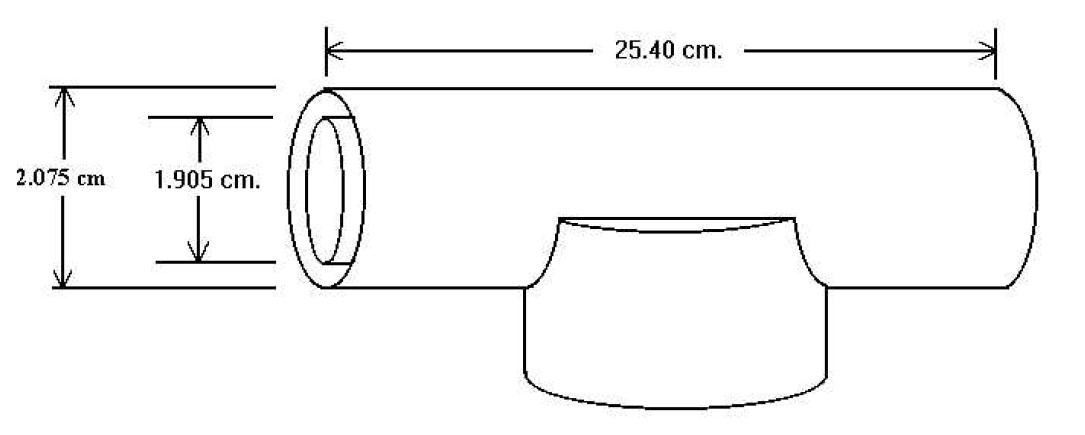
Figure 2: Schematic of the two cylinders used to measure the thermal conductivity of gases.
3.3 Data Acquisition
Data from this experiment is displayed and recorded by a combination of an Arduino taking measurements and a Python program reading the Arduino output to the PC. The temperature difference between the cylinders is measured using a thermocouple reader that has been designed to ‘plug-and-play’ with an Arduino. Note that you will be wiring the temperature sensor to the Arduino yourself.
The pressure gauge has an analog voltage output that is queried by the Arduino. Note that the pressure gauge output is 0-10 V and the Arduino is only meant to handle 0-5 V, so we’re using a voltage divider to cut the sensor output in half. You will connect the pressure sensor to the analog input of the Arduino.
Once the Arduino is wired, you’ll upload the program. The Python program reads the output from the Arduino and makes plots of temperature and pressure vs time, and temperature vs pressure. Start the program by running the Python code. The data should start populating the plots within a second or two. The program has two buttons: one to save your data (takes a minute since the program is trying to save data and generate the plots simultaneously), and a second button to stop the program (and erase any data that is displayed). When saving data, please try to use a relatively unique file name or folder so you don’t confuse your work with someone else’s.