Rotational Inertia
Experimental Apparatus
The apparatus is shown in Figure 4.
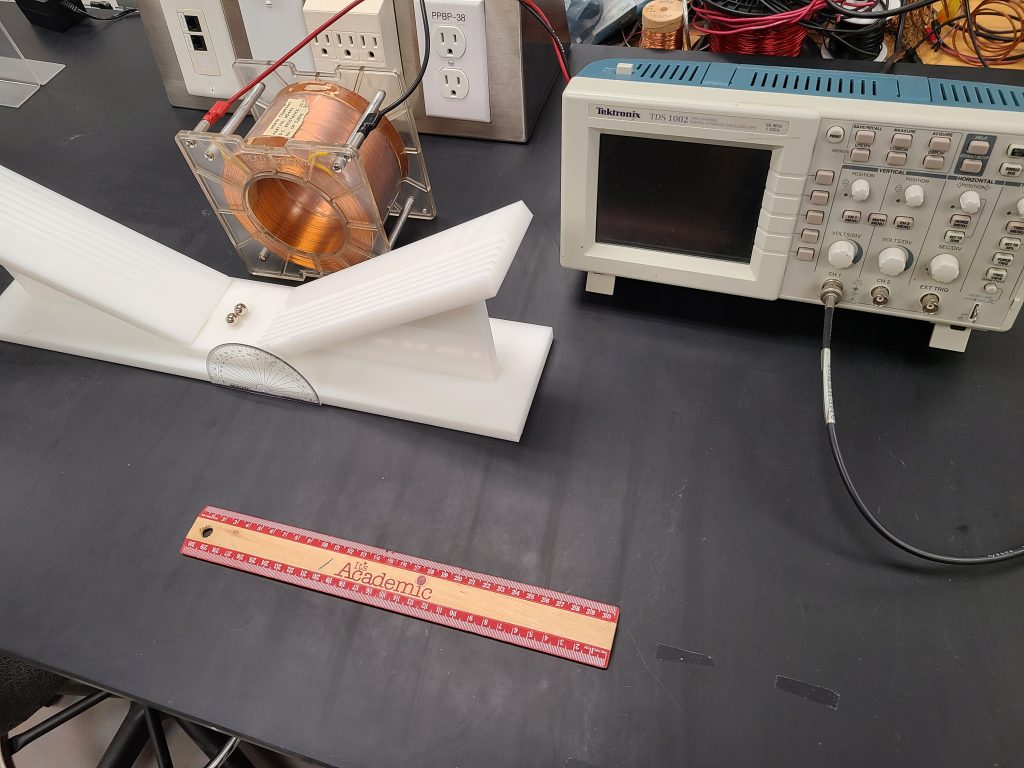
Figure 4: Rotational inertia apparatus. The spherical magnets roll down the inclined planes and collide in front of the pickup coil, which is connected to the oscilloscope.
Spherical Magnets
The spherical magnets used in this experiment are made of Neodymium. They are VERY strong magnets, with up to five pounds of force each. Be very careful handling these magnets. They have a pole at the top and bottom, like a bar magnet but rounder. Relevant specifications of the magnets used in this experiment are shown in Table 1.
|
diameter (inches) |
weight (g) |
pull force (lbs) |
|
5⁄16 (0.3125) |
1.96 |
2.5 |
|
3⁄8 (0.375) |
3.39 |
3.7 |
|
7⁄16 (0.4375) |
5.4 |
5.0 |
|
1/2 (0.5) |
8.05 |
8.0 |
Table 1: Spherical magnet specifications.
Plastic Jig
The entire apparatus MUST be made of non-magnetic materials to avoid erroneous magnetic fields influencing the momentum of the spheres. Beyond that, the ramp and base plate must be non-metal because the changing magnetic fields from the rolling magnet would generate Eddy currents within the metal, which is a loss of energy that we don’t want to account for.
The specific material for the ramp and baseplate is acetal. Acetal is a very hard, very smooth plastic that is easily machined. The ramp is machined with 1⁄4” wide, 1⁄8” deep rivets so that the impact parameter can be precisely set. As long as the diameter of the magnetic sphere is larger than 1⁄4”, then the sphere will only contact two points as it rolls down the precisely-set trajectory, thereby minimizing friction due to contact. Note that the calculated velocity changes slightly from Equation(6) because the sphere rolls along a radius ( ) slightly smaller than the radius of the sphere (r), as shown in Figure 5. The kinetic energy is then defined as
(1) ![\begin{equation*} \left[1+\frac{2}{5} \left(\frac{r}{r'}\right)^2 \right]\frac{1}{2}mv^2 \end{equation*}](https://ecampusontario.pressbooks.pub/app/uploads/quicklatex/quicklatex.com-26ba513d120e975c8168a25d588d4ba3_l3.png "Rendered by QuickLaTeX.com")
The base plate is machined with a very slight curvature making a 0.5-mm deep bowl. This curvature is strong enough to keep the rotating magnets near the center of the baseplate and, thus, at a constant distance from the pickup coils, but shallow enough to not significantly change the initial trajectory of the individual magnets or their rotation once they collide.
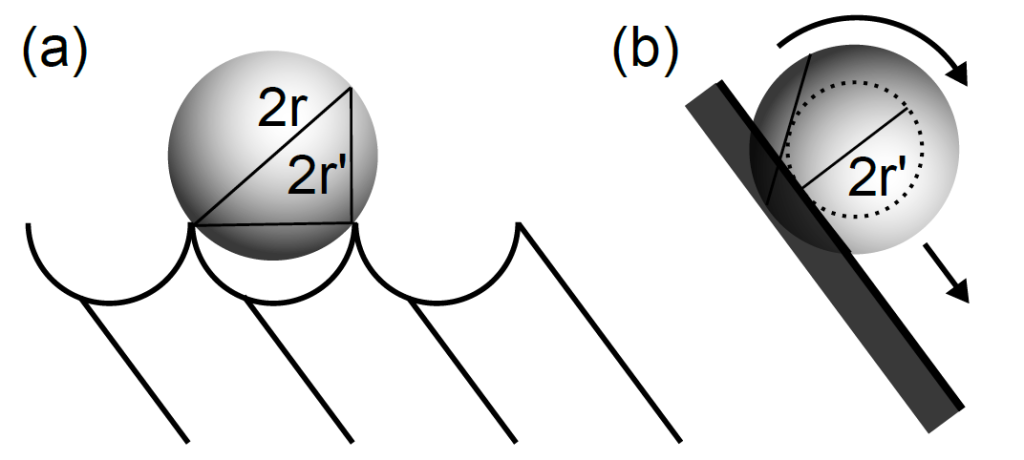
Figure 5: Two views of a spherical magnet rolling along rivets machined into the plastic inclined planes. The kinetic energy is slightly different than it would have been if the ball was rolling with one point of contact along a flat surface. Note the smaller radius of revolution, clearly seen in (b).
PickUp Coil
The pickup coil is pretty simple. It’s a solenoid made of insulated copper wire. The housing for the pickup coil is non-magnetic and has convenient banana jacks to connect to the oscilloscope.
Oscilloscope
The oscilloscope is used to measure the induced voltage in the coil as a function of time. The most important knobs on the oscilloscope are detailed below.
Trigger
The oscilloscope is constantly exposed to the signal from the pickup coils. We need to set the oscilloscope to save and display data only when the magnets are undergoing the inward spiral, merger and ringdown. That is to say, the oscilloscope must be triggered to start saving data at a specific time, based on the measured signal. The oscilloscope you will use in this experiment has a `Trigger’ menu where the user can set the voltage level (indicated by an arrow on the right side of the display) and condition at which to start saving and displaying data. A small arrow at the top of the display indicates when the trigger condition will be met.
horizontal axis
The oscilloscope used in this experiment is able to measure signals from tens of seconds to nanoseconds. The seconds/division knob (SEC/DIV) controls the scale of the horizontal access. The seconds/division is displayed at the bottom of the oscilloscope display. As you adjust the timescale, keep in mind that the trigger arrow may move off the screen if you change the scale by an order of magnitude or so.
Cursors
The ‘Cursor’ menu on the oscilloscope brings up two cursors that are controlled using the channel 1 and channel 2 position knobs. The cursors can be used in the vertical (voltage) or horizontal (time) axes. The oscilloscope menu displays the time difference and, because a lot of people do this, displays the ‘frequency’ that would result if the cursor difference was a wavelength.