PART 2: Circuit Analysis
In this part, we will examine circuits which have a variety of resistors in series and in parallel. We will determine the equivalent resistance of those circuits analytically, and experimentally determine the equivalent resistance for these circuits using linear regression.
PROCEDURE
Consider Circuit_2 given below. Analytically determine the expected equivalent resistance and record the calculated value of your equivalent resistance (given the resistor values shown below) in the lab report.
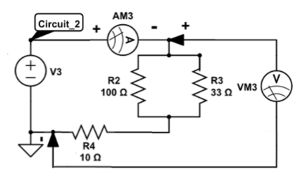
To measure the voltage and current from an equivalent resistance for a desired circuit experimentally, build the desired circuit using the building blocks and set the ammeter just after the power supply. The voltmeter should be parallel across all the resistors within the circuit.
Construct Circuit_2 and determine the equivalent resistance experimentally through PASCO Capstone using the following procedure:
- Create a graph in Capstone which has Voltage on the y-axis and Current on the x-axis.
- Select “Signal Generator” under tools on the left-hand side (this option may be hidden, you can select it from the ellipses just under the name). From here, we are going to setup a new power supply:
a. Select “Positive Ramp” as your waveform. Set the:
i. Frequency to be 0.1 Hz,
ii. Phase Shift to be 0,
iii. Voltage Offset to be 1V,
iv. and the Amplitude to be 1V.
This will sweep the voltage source from values of 0V to 2V over time.
b. Select “Recording Conditions” at the bottom of the screen (next to “Delete Last Run”). Select “Stop Condition” with a condition type of “Time Based”, and a “Record Time” of 10 seconds and click “OK”. This will stop recording data after 10 seconds.
c. Set the “Sample Rate” to 2Hz. To do this, select “Wireless Current Module” in the record ribbon and change it to “Common Rate”. This will tell Capstone to only record data every 0.5 seconds.
d. Turn on the Signal Generator.
After you do steps 1 and 2 from this procedure for Circuit_2, you do not need to repeat them. Steps 1 and 2 were simply to set up our voltage source and the recording structure. However, if you disconnect your voltmeter or ammeter from Capstone, you may need to repeat these steps.
- Select “Record” and observe how the voltage and current change over time. If there are any notable outliers, just delete the last run and record again.

CHECKPOINT
(Ask the TA to check your graph of Voltage versus Current for Circuit_2)
- Once you are confident with your data, label the data based on the circuit you are examining (i.e. “Circuit_2”, …). You can do this by selecting “Data Summary”, and double clicking the run.
- Export this data from Capstone and import it into Excel. To do this, you may Right click on the csv file you just saved. Then go to “open with” -> “Microsoft Office Excel”. Alternatively, you may go with a slightly longer route by following the steps below:
a. Select “File” tab within Capstone and then “Export Data…”. The data file generated should automatically be in a comma separated value (CSV) format.
b. Deselect any data that is not desired (for example, time).
c. Select “Export to file…” in bottom right corner. Name the file an appropriate name and save it to your station folder with an appropriate name (“Circuit2_data.csv” for example)
d. Open Microsoft Excel and select the “Data” tab. In the top left, select “Get Data” “From File” “From Text/CSV”. Select the CSV file you recently saved and click “Import” “Load”.
6. Create a plot of Voltage versus Current from the loaded data in Excel. There are multiple ways to do this, but the easiest is to:
a. Click the “Insert” tab “Charts” “Insert Scatter (X,Y) or Bubble Chart” “Scatter”.
b. Right click the empty graph, select “Select Data”“Add”.
c. Left click under “Series X values:”highlight the Current column. Likewise, do this for the “Series Y values:” for the Voltage column.
7. Give your plot a title and appropriate axis labels. To do this:
a. Left click anywhere on the graph, select “Chart Design” tab, then select “Add Chart Elements”.
8. Insert a trendline on the graph and display the equation & value on the graph. To do this:
a. Right click the data series in the graph, select “Add Trendline …”  “Display Equation on chart” “Display R-squared value on chart”.
Copy and paste the graph of Voltage versus Current into your report.
Question 4
Question 5