PART 2: Charging through a Resistor
PROCEDURE
- For this part of the experiment, we need to ensure the capacitor is fully discharged before we construct Circuit_2. To do this, take a cable or wire with small resistance and hold its two ends to the two ends of the capacitor for a few seconds to discharge. This will discharge the capacitor at a relatively fast rate.
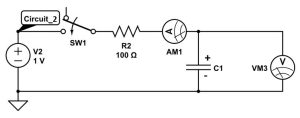
- Now construct Circuit_2 as shown above with the
 resistor. Make sure your capacitor is fully discharged before doing this (refer to step 1 if you have not done so). To keep the capacitor discharged, make sure the switch is left open when connecting it to the circuit.
 - On Capstone, create two graphs. One graph will show voltage over time, and the other graph will show current over time. These are measured directly from the wireless voltmeter and the current module.
- Set the power supply within Capstone to the settings:
- Waveform=DC.
- DC Voltage=1V
- Set the frequency of measurement at the “Common Rate” of 500Hz at the bottom of the page (this will record a value for voltage and current every millisecond simultaneously).
- When you have Circuit_2 constructed with the power supply connected and turned on, click record. Make sure the voltage still reads ~ 0 V. If it doesn’t, take a cable or wire with small resistance and hold its two ends to the two ends of the capacitor for a few seconds to discharge. Then stop, remove the cable and click record again so that the initial voltage is ~ 0 V. After a few seconds (<5 seconds), close the switch and observe the current and voltage curves. About 10 seconds after closing the circuit, stop recording.
a. According to theory, the current should look like a negative exponential
(9) 
The voltage will analogously look like
(10) 
where  is the voltage of the power supply.

CHECKPOINT
(Ask the TA to check your graphs. If they are incorrect, repeat the procedure from step 1. The capacitor will need to be discharged before you can redo these measurements.)
****IMPORTANT **** If you are not getting the desired result, you may need to discharge your capacitor before going through this procedure again. To do this, take a cable or wire with small resistance and hold its two ends to the two ends of the capacitor for a few seconds to discharge.
- For the current versus time graph, click on “Highlight range of points in active data” at the top of the graph and select the range of points from when the switch was closed to the final time. Then click on “Display area under highlighter data” at the top of the graph (it will look like a parabola with grey shading underneath). When you click this, it should give an area underneath the data for the Current versus time graph for the selected range.
- Theoretically, the area under the current versus time graph is the total charge accumulated by the capacitor.
![\[I = - \frac{dQ}{dt} \Rightarrow Q = - \int ^{t'}_{t_0} I(t) dt\]](https://ecampusontario.pressbooks.pub/app/uploads/quicklatex/quicklatex.com-360fbde3e913d1dc6241a7ca12595de3_l3.png "Rendered by QuickLaTeX.com")
Write down the total charge accumulated from when the switch was closed to the final time.
- Using the value of
 you found in the previous step, calculate the capacitance and write both of their values in the report.
 - Copy and paste your graphs from Capstone onto your word report.
Question 5
Question 6
Notes on the definition of relevant to Question 7. The value of  (this is different from the
  value you previously calculated) is what we call the time constant for the RC circuit and it remains the same regardless of if we are charging the capacitor through a resistor or discharging the capacitor through a resistor. We can determine the time constant from Equation (10) and it can be evaluated as with SI units of seconds. For the charging RC circuit (Part 2), represents the time it takes the voltage to reach 63% of the power supplies voltage.
Question 7
 , what is the value of the time constant (for Circuit_2) in SI units? At time
  on your Voltage versus Time graph, is the value for voltage what you expect? Explain. Note: for voltage of the power supply, use the voltage that your voltage versus time graph asymptotes to.
Question 8
) with your experimentally determined values of  from Part 1 instead. Do they provide a more accurate result for as per the definition of the time constant? Explain.