Part 1: Charging through an LR Circuit
PROCEDURE
1. Measure the internal resistance of the inductor ( ) and ammeter (
 ) through the ohmmeter. Record their values in the report. To do this:
a. Set your multimeter to measure resistance. This is indicated by the capital omega ( ) section of the multimeter.
i. Note: for the resistors we are working with in this section, you will only need to use the “200” scale setting.
b. Take the positive and negative alligator clamps and connect them to the metal prongs of the ammeter or inductor.
i. Note: it does not matter which orientation the positive and negative terminals are since resistance is non-directional.
c. After a few seconds, record the value shown on the ohmmeter into your report.
d. We will ignore the uncertainty of the resistance read by the ohmmeter for this experiment.
e. Note: we will need these values to calculate the inductance of our inductor.
2. Create a Voltage versus Time and Current versus Time graph on Capstone. As a reminder:
a. You can do this by clicking on the “Add new plot area to the graph display” button at the top of your graphs. It looks like an x and y axis with a green cog in the middle.
b. Note: when you turn on the voltmeter and ammeter and appropriately set up the Bluetooth, you can add the voltage and current by clicking on the y-axis label.
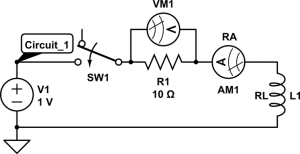
3. Construct Circuit_1 exactly as shown above with the following settings:
a. Waveform=DC.
b. DC Voltage=1V.
c. Set the frequency of measurement to the “Common Rate” of 1 kHz (this will record a value for voltage and current every millisecond).
Note: we are measuring the voltage over the resistor ONLY (as opposed to the voltage of the entire circuit).
4. Once your circuit is made, with the switch OPENED, turn on the power supply and start recording. After a few seconds (<2s), close the circuit and stop recording a few seconds after.
a. Note: Capstone has trouble tracking large amounts of data, so chances are it will automatically stop recording after about 6s.
5. Your voltage and current may seem to show an instantaneous jump the moment you close the circuit. Zoom in on the x-axis over the range when the switch is first closed to a few milliseconds afterwards (200ms). To do this, you can either:
a. Right click on the time axis, go to “Axis Scaling” and manually enter the min/max values.
b. Click and drag on the x-axis from left to right.
This should show you a curve similar to what the theory predicts. As a sanity check, the moment the circuit is closed , our inductor should have a voltage of  , i.e., approximately the voltage of the source.
6. Calculate the time constant using the Current versus Time graph. According to theory, the time constant is measured as the length of time it takes the CURRENT to reach 63.21% of its maximum value.
a. Record the value of your time constant in the report for this resistance and voltage in table 1.

CHECKPOINT
(Ask the TA to check your graphs and your value for  at 1V)
7. Open the circuit and repeat steps 3-6, but with a voltage source of 2V and 4V. Record the average value for your time constant along with the standard deviation from your different voltages at that resistance in Table 2 of the report.
8. FOR THE 4V SOURCE ONLY:
- Title your graph based on the resistors value. You can change the title by double clicking on the bottom left where it says “[Graph Title Here]”. Copy and paste your graph from Capstone into your word report.
- Measure the value for voltage as time gets very large and record that value in Table 2 of your report.
9. Calculate the inductance using the average value of your time constant and the TOTAL resistance of the circuit. You can calculate the total resistance ( ) of the circuit by considering the internal resistance of the ammeter (
 ), the internal resistance of the inductor (
 ), and the resistor’s value. The total resistance will be
  .
.
10. Repeat steps 3-9 with resistors of value  and
and  , and then calculate the average inductance of the calculated inductances for each resistor.
Since our inductor and ammeter have an associated internal resistance with them, the voltage over time is predicted to asymptote to a value of
![\[V(t \rightarrow \infty) = V_T \left( \frac{R}{R_T}\right)\]](https://ecampusontario.pressbooks.pub/app/uploads/quicklatex/quicklatex.com-6cc04646966729fd9a4350c53b7fc161_l3.png "Rendered by QuickLaTeX.com")
where  is the total voltage provided by the power supply,
  is the resistors value, and is the total resistance of the resistor, internal resistance of the ammeter, and internal resistance of the inductor combined (see Theory section).
Question 1
Question 2
 in this lab more accurate compared to the average value calculated in Lab 3? Explain why. Hint: will Capstone allow us to measure at a higher frequency?
Question 3
Is the behaviour of voltage versus time as time gets very large consistent with what the theory predicts? What about the moment the circuit is closed? Compare and contrast between the different resistor values.