Introduction
INTRODUCTION
Everything measured in the world has an inherent uncertainty associated with it. Without that uncertainty, the measurement is meaningless. This is because the uncertainty tells us how the measurement was made, what was involved in making this measurement, and how confident we are that the measurement is accurate. As you will see in this lab, uncertainties are primarily attributed to either Systematic Errors in the methods of measurement, or Random Errors in the nature of the measurement.
Random (Statistical) Errors are based on the precision of the measurement device and are associated with the experimenter’s inability to make the exact same measurement twice. This inability is due to the limitations of the measurement device. We encapsulate this idea by saying that the measurement uncertainty is ![]() half the smallest increment of the measurement device. This is because the true value of the measurement could either be larger or smaller by approximately half of this smallest increment based on this measurement device. Systematic Errors, on the other hand, are inherently based on the procedure or the nature of the equipment and are usually more difficult to determine. An example of a systematic error would be the error that occurs due to reading a measurement from a meter stick that is not at eye level – your perception of the value changes based on the angle of your eyes to the target.
half the smallest increment of the measurement device. This is because the true value of the measurement could either be larger or smaller by approximately half of this smallest increment based on this measurement device. Systematic Errors, on the other hand, are inherently based on the procedure or the nature of the equipment and are usually more difficult to determine. An example of a systematic error would be the error that occurs due to reading a measurement from a meter stick that is not at eye level – your perception of the value changes based on the angle of your eyes to the target.
To learn how we can incorporate uncertainty into our measurements, we are going to study pendulums and the physics behind them within the lab. This experiment will consist of two pendulums, one is what we call a ‘simple pendulum,’ which has a ball bearing attached to a string and is swung about the top of a support. The other pendulum is what we call a ‘physical pendulum,’ which is a uniform bar that can rotate about several pivot points. The goals of this lab are to understand uncertainties and to understand how uncertainties are used to justify experimental results against theoretical predictions.
PURPOSE
In the first part of this experiment, you will measure the strength of the Earth’s gravitational field by observing the period of a simple pendulum. The measurements themselves are straightforward in order to give you time to explore the use of graphs, to interpret experimental results, and to further carry out analysis of experimental uncertainties.
In the second part of the experiment, you will then determine how the period of a physical pendulum depends on the distance of the pivot point to the centre of mass. You will be expected to complete a report that includes thoughtful discussion of your results using the attached template by answering the questions with complete explanations.
THEORY
Simple Pendulum

According to the theory of a simple pendulum, the period ![]() (the time for one complete swing) is given by
(the time for one complete swing) is given by
(1) 
where ![]() is the length of the pendulum and
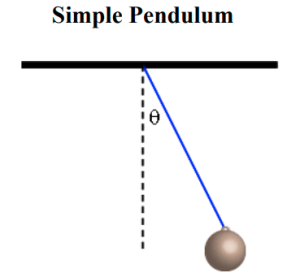
is the length of the pendulum and ![]() is the gravitational acceleration. Please refer to Figure 1 for an example of a simple pendulum. In deriving this result, certain assumptions are made: 1) the pendulum consists of a point mass suspended by a massless string of length
is the gravitational acceleration. Please refer to Figure 1 for an example of a simple pendulum. In deriving this result, certain assumptions are made: 1) the pendulum consists of a point mass suspended by a massless string of length ![]() from a fixed support, and 2) the amplitude of the swing is small, i.e.,
from a fixed support, and 2) the amplitude of the swing is small, i.e., ![]() (measured as the angle between the vertical and the string at the maximum of its swing).
(measured as the angle between the vertical and the string at the maximum of its swing).
Squaring Equation (1) yields the following relation, which will be used for analysis of your data.
(2) ![]()
Physical Pendulum
This part of the theory can be skipped without any loss of insight for the experiment.
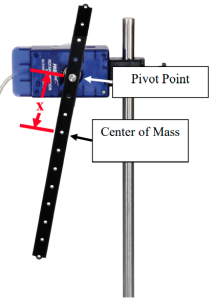
This experiment explores the dependence of the period of a physical pendulum (a uniform bar) on the distance between the pivot point and the center of mass of the physical pendulum. The experimental setup is illustrated in Figure 2.
Think about the two extremes:
- When the pendulum is pivoting about the end, do you expect that the period is longer or shorter than if it is pivoting about the first hole down?
- When the pendulum is pivoting about the center of the rod, what will the period be?
In considering these two questions, as the pivot is moved toward the centre, the period starts to decrease. It then reaches a minimum before starting to increase and becomes infinitely long at the centre. That means that there should be a place between one of the end points and the centre where the period is at a minimum. We can apply simple calculus to find the minimum period of the physical pendulum. In this lab, we will determine the minimum period experimentally.

The period of a physical pendulum for a small amplitude is given by:
(3) 
‘Small amplitude’ for our purposes means any angle 15º or less. The error when using Equation (3) is less than 1% at 15º. ![]() is the moment of inertia of the pendulum about the pivot point,
is the moment of inertia of the pendulum about the pivot point, ![]() is the total mass of the pendulum, and
is the total mass of the pendulum, and ![]() is the distance from the pivot to the center of mass. A uniform rectangular bar has a moment of inertia (
is the distance from the pivot to the center of mass. A uniform rectangular bar has a moment of inertia (![]() ) about its center of mass given by
) about its center of mass given by
(4) ![]()
where ![]() is the mass,
is the mass, ![]() is the length and
is the length and ![]() is the width of the bar. For the 28-cm Pendulum Bar,
is the width of the bar. For the 28-cm Pendulum Bar, ![]() and we can simplify this expression to:
and we can simplify this expression to:
(5) ![]()
which gives a moment of inertia that is only off by about 0.3%.
The parallel axis theorem enables us to write the moment of inertia of the bar about a pivot point a distance ![]() from the center of mass as:
from the center of mass as:
(6) ![]()
and Equation (3) becomes
(7) 
(Optional: Use calculus to find the derivative of the period, ![]() , with respect to
, with respect to ![]() , and set it equal to 0 to find the value of
, and set it equal to 0 to find the value of ![]() that will produce the minimum period.)
that will produce the minimum period.)
