Lab 8 Assignment: Resistance as a Function of Temperature
Lab 8 Assignment: Resistance as a Function of Temperature
Due: Monday, March 17th, 2025 on Crowdmark
Since the electrical resistance of a conductor is dependent upon collision processes within the wire, the resistance can be expected to increase with temperature. Theory predicts that the fractional change in resistance is proportional to the temperature change, i.e.
[latex]\frac{\Delta R}{R} = \alpha \Delta T[/latex]
This can be rewritten in the more useful form
[latex]R(T) = R_o + R_o\alpha(T-T_o) \ \ \ \ (1)[/latex]
where α is the temperature coefficient of resistance, an intrinsic property of the conductor, and [latex]R_o[/latex] is a reference resistance at some temperature, [latex]T_o[/latex], commonly, 20 oC. If you rewrite Eq (1) as
[latex]R(T) = R_o + R_o\alpha T' \ \ \ \ (2)[/latex]
(where [latex]T' = T - 20^\circ[/latex]) then you can easily extract [latex]R_o[/latex] and α from a plot of [latex]R[/latex] vs [latex]T'[/latex] using linear regression.
For each of your two wire samples (yellow and blue/green):
1. Summarize the data and present it in a table. (Suggestions for how to set up the table can be found on the next page.)
2. Plot [latex]R[/latex] vs [latex]T'[/latex] (the temperature relative to the reference temperature). Data points should be shown with uncertainties. Your graph should be suitably sized and scaled so that all relevant detail is visible. A trendline and descriptive equation should appear on each graph.
3. Estimate the temperature coefficients and uncertainties. Depending on your data uncertainties, you may want to use the Excel function “linest” to estimate the uncertainties on slope and intercept, or you may want to do it manually (as demonstrated in the linear regression lab.) Make sure that your final result is presented correctly (i.e. the uncertainty to one significant figure and the result with the same precision).
4. Compare your measured temperature coefficients to standard values. The website …
https://www.allaboutcircuits.com/textbook/direct-current/chpt-12/temperature-coefficient-resistance/
… gives α for some common metals using the room temperature reference resistance.
Suggestions for submitting your data...
You might want to set up a table like this for EACH sample:
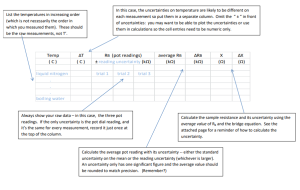
Uncertainty on the Sample Resistance
If you set up the circuit as suggested in the lab (see the diagram) you will have measured RB on the pot dial and would calculate your sample resistance, X, as
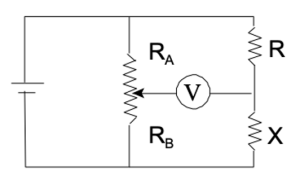
[latex]X = R \frac{R_B}{R_A}=R\frac{R_B}{R_{POT}-R_B}[/latex]
where [latex]R[/latex] is the known 10 Ω resistor and [latex]R_A + R_B = R_{POT}[/latex] (10 kΩ). In principle, uncertainties on [latex]R[/latex] and [latex]R_{POT}[/latex] will contribute to the uncertainty on [latex]X[/latex]. In practice, these contributions are small and we will ignore them here.
You will recall from our treatment of uncertainties that if a variable, f, is a function of another variable x, the uncertainty on f is calculated through the derivative:
[latex]\delta f = \frac{df}{dx}\delta x[/latex]
where [latex]\delta x[/latex] is the uncertainty on [latex]x[/latex] and [latex]\delta f[/latex] is the uncertainty on [latex]f[/latex]. Treating [latex]R[/latex] and [latex]R_{POT}[/latex] as constants, you can calculate the uncertainty on [latex]X[/latex] as
[latex]\delta X = \frac{dX}{dR_B}\delta R_B[/latex]