Lab 11: Atomic Spectra
(Adapted from Pasco lab manual, A. Hanks)
The atomic spectra of hydrogen and helium are scanned by hand using a grating spectrophotometer that measures relative light intensity as a function of angle. The spectrophotometer allows you to view and measure the spectral pattern (spectrum) produced by a light source (see Figure 1). The grating disperses the beam of light into a spectrum with different colours at different angles but with all of the light of a given colour in a parallel beam. The focusing lens focuses these parallel beams of colour into spectral lines.
From the resulting graph, the wavelengths of the spectral lines are determined by measuring the angle from the central maximum to each line. First order lines are examined. The spectrum of helium is used to calibrate the diffraction grating. The wavelengths of the spectral lines are compared to the accepted values and, in the case of hydrogen, the electron orbit transitions corresponding to the lines are identified. Finally, the spectrum of an unknown gas is matched against a list of template spectra to identify the emitting substance.
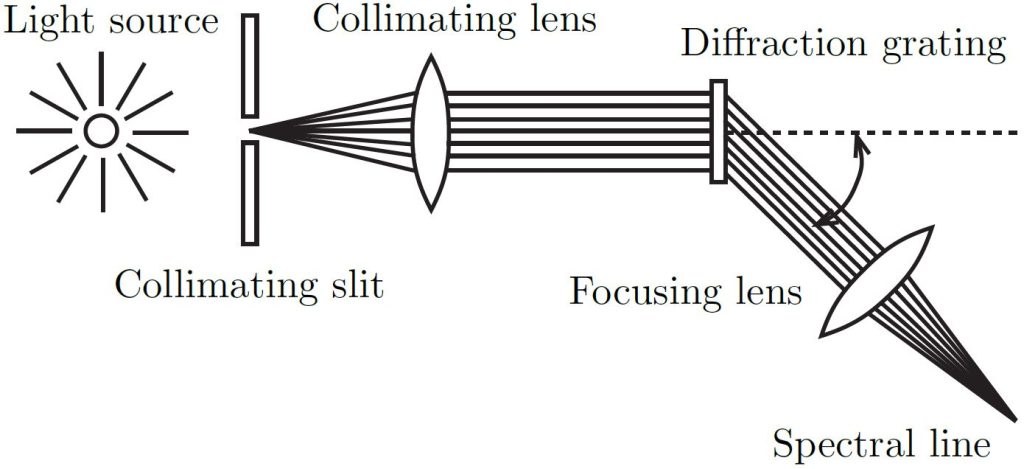
Figure 1: Schematic of spectrophotometer apparatus forming spectral lines.
Apparatus
In this experiment you will analyze measurements made from an optical grating used to separate the light emitted by different gases into their discrete spectra. A grating is a piece of transparent material on which a large number of equally spaced parallel lines have been ruled. The distance between the lines is called the grating line spacing, [latex]d[/latex]. Figure 2 shows a close-up view of several of the lines in a diffraction grating.
The lines in the grating block the light incident on it while the gaps allow light to pass through. The light that passes through is emitted in all directions, but the presence of the other gaps causes the light to be visible in only certain directions. In the direction of the angle [latex]\theta[/latex], light rays A and B will add up, or constructively interfere, and will result in a bright spot in that direction. This happens because the difference in the length of ray A and B is such that the peaks and valleys in the light waves will line up perfectly. Whenever the angle causes the lengths to differ by 1, 2, 3,. . . wavelengths, there will be a bright spot. At other angles, the length difference will not be an integer number of wavelengths, so the peaks and valleys will not line up. In that case, the light will cancel out, or destructively interfere, creating a dark spot in that direction. For a single wavelength of light, this will create repeating spots of light and dark (maxima and minima) as you move through angles from the horizontal in Figure 2, to angles above and below horizontal.
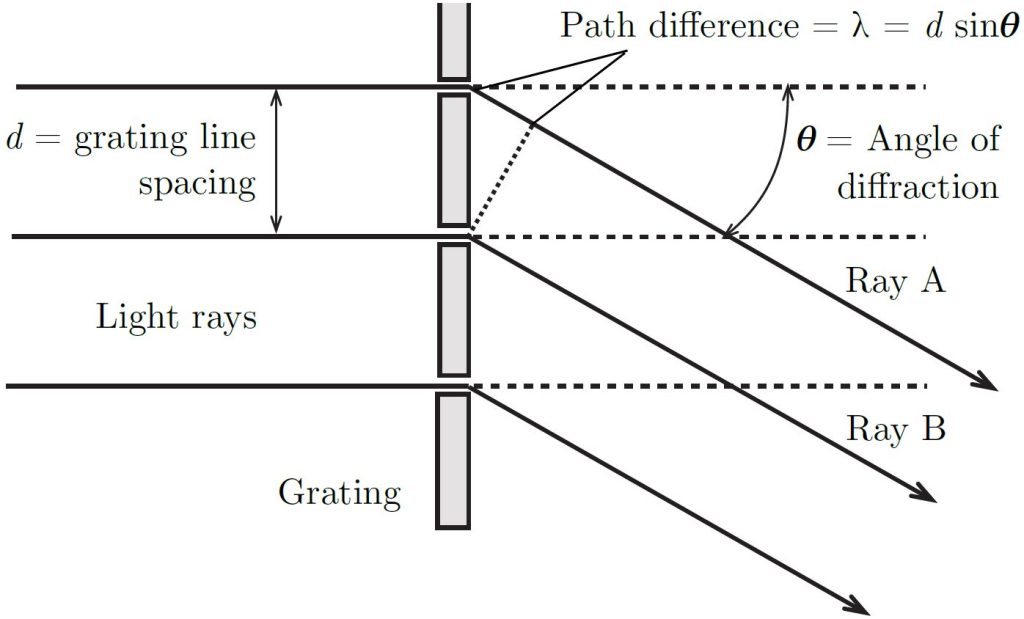
Figure 2: Ray diagram for the first-order diffraction pattern produced by a diffraction grating. The light source is to the left, the shaded rectangles represent the lines in the grating which block the light, and the gaps allow light to pass through. At the angle shown, [latex]\theta[/latex], rays A and B will add up to create a bright spot.
The angles to the bright maxima are given by
\begin{equation} \tag{1} \label{4.5} d sin(\theta)=m\lambda \end{equation}
where [latex]d[/latex] is the separation between lines in the grating, [latex]\lambda[/latex] is the wavelength of the light, and [latex]m[/latex] is the order number (and takes only integer values of 0, 1, 2,. . .). The order number is just telling you which bright spot you are looking at as you count out from the center horizontal line. Figure 4 shows how the [latex]m=0[/latex] ray comes straight from the light source through the grating. The [latex]m=1[/latex] maxima are angled away from the light source, symmetrically above and below the central horizontal line.
When there is a mixture of colours (light wavelengths) coming from the light source, the angle towards a bright spot will be different for each colour (see Equation 1). The grating therefore acts to split apart the different colours and send them in different directions. This will allow you to see the individual colours emitted by different gases (recall these colours are the result of electrons jumping between the specific orbits as described in the Theory Section).
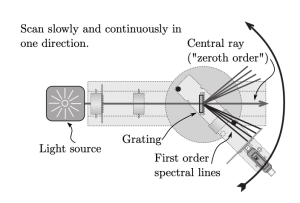
Figure 3: Top-down view of the apparatus showing the location of the [latex]m = 0[/latex] central ray (or “zeroth-order”), the [latex]m = 1[/latex] (first-order) spectral lines on either side of the central ray, and how the sensor arm moves through the spectra. This orientation is the same as how the grating is shown in Figure 2.
Theory
An incandescent source such as a hot solid metal filament emits a continuous spectrum of wavelengths. In contrast, light produced by an electric discharge in a rarefied gas of a single element contains a limited number of discrete wavelengths - an emission or “bright line” spectrum. The pattern of colours in an emission spectrum is characteristic of the element. The individual colours appear in the shape of “bright lines” because the light that is separated into the spectrum usually passes through a narrow slit illuminated by the light source.
Light is given off by an atom when an excited electron decays from a higher energy orbit to a lower energy orbit. Figure 2 shows this for the transition from the [latex]n=3[/latex] to [latex]n=2[/latex] orbit in hydrogen. The energy levels of the electron orbits in a hydrogen atom are given by
\begin{equation} \tag{2} \label{4.1} E = - \left( \frac{m_e e^4}{8 \epsilon_0^2 h^2} \right) \left( \frac{1}{n^2} \right) \end{equation}
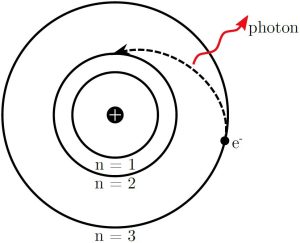
Figure 2: Schematic of light emission from hydrogen atom as the electron decays from the [latex]n = 3[/latex] to the [latex]n = 2[/latex] orbit.
where [latex]m_e[/latex] is the mass of the electron, [latex]e[/latex] is the charge of the electron, [latex]\varepsilon_0[/latex] is the permittivity constant, [latex]h[/latex] is Planck’s constant, and [latex]n[/latex] is the orbital number (taking only values 1, 2, 3,. . .). Plugging the physical constants into Equation \ref{4.1} gives
\begin{equation} \tag{3} \label{4.2} E = - (13.6~ \text{eV}) \left( \frac{1}{n^2} \right). \end{equation}
The energy of the photon, [latex]\Delta E[/latex], is the negative of the energy lost by the electron and is given by
\begin{equation} \tag{4} \label{4.3} \Delta E = - (E_f - E_i) = (13.6 ~ \text{eV}) \left( \frac{1}{n_f^2} - \frac{1}{n_i^2} \right). \end{equation}
For the visible photons given off by hydrogen, the final energy level is [latex]n_f =2[/latex] and the initial energy levels are [latex]n_i = 3, 4, 5[/latex], ... The frequency, [latex]f[/latex], of the emitted photon is determined by
\begin{equation} \tag{5} \label{4.4} f = \frac{\Delta E}{ h}. \end{equation}
This can be converted to the wavelength of the photon using
\begin{equation} \tag{6} \label{4.6} \lambda = \frac{c}{f}, \end{equation}
where [latex]c[/latex] is the speed of light.
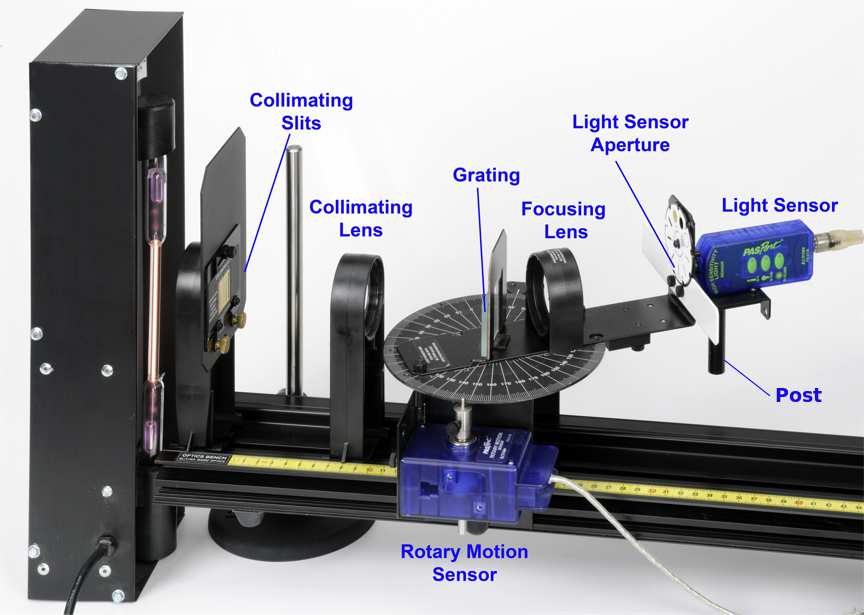
Figure 5: Breakdown of the components that make up the grating spectrophotometer (side view). The lamp is the tall black box on the left side of the photo.
Procedure
The full procedure is available within the Capstone workbook in the lab, so here we provide a brief overview of what you will be doing in this experiment.
Figure 5 shows a labelled photo of the apparatus used to measure the data you will be analyzing in this experiment. There is a video on Avenue “Apparatus introduction” which provides a description of each part of the apparatus. You may compare these to Figures 1, 2, 3, and 5 to get familiar with how light passes through the grating to create the spectral lines, and how the apparatus will measure the light.
In this experiment you will analyze the different colours of the spectra emitted by helium, hydrogen, and one mystery gas measured with the grating spectrophotometer. From the resulting graphs, you will determine the wavelengths of the spectral lines by measuring the angle from the central maximum to each line. Only [latex]m=1[/latex] lines will be examined. The spectrum of helium will be used to calibrate the diffraction grating. Then you will compare your estimated wavelengths of the spectral lines to the accepted values. In the case of hydrogen, you will identify the electron orbit transitions corresponding to the observed lines. Finally, you will match the spectrum of an unknown gas to template spectra to identify the emitting substance.
