Kinematics Exercise 1: Setting up Capstone
Kinematics
Exercise 1: Setting up Capstone
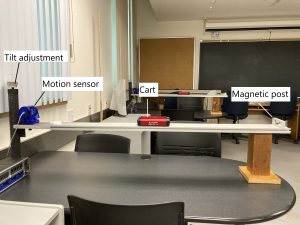
At your desk you should find a short piece of track with a motion sensor mounted at one end. You can adjust the tilt of the track using the large screw on the top of the end support. Place the cart on a (more or less) level track.
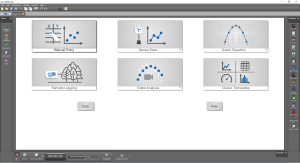
Launch Capstone (Only double-click the shortcut icon once and wait) then select Sensor Data.
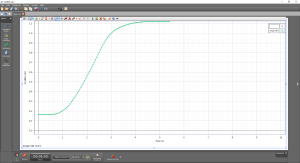
Collect data as you move a cart from one end of the track to the other so that the cart begins and ends at rest. (It would be best to move the cart energetically so that the velocity and accelerations are large enough to be easily observed! Keep your fingers on the side of the cart, out of the way of the sensor beam.) The software should automatically plot the position of motion sensor Ch 1.
Discuss the following questions with your group. Come to a consensus and make brief notes in your lab notebook. (Leave your measurements on the screen until you have discussed the exercise with your lab instructor.)
- Look at the position-time graph. What is the reference frame assumed by the Capstone software? (i.e. physically, where is zero and which way is positive?)
- Given the reference frame, what would you expect the sign of the velocity to be while the cart was moving? Is this what you see in your data? You will probably want to add the velocity plot to your screen in addition to the position-time plot. You can do this by clicking the “Add new plot area to the Graph display”
 button that sits above your current plot. Plot velocity by clicking the y axis label and selecting “Velocity”.
 - Does the sign of the velocity depend on whether the cart is speeding up or slowing down?
- Given the reference frame, what would you expect the sign of the acceleration to be while the cart was moving? Is this what you see in your data? You will probably want to add the acceleration plot to your screen as well. You can do this by clicking the “Add new plot area to the Graph display” button that sits above your current plot. Plot acceleration by clicking the y axis label and selecting “Acceleration”.
- If I tell you that an object has a positive acceleration, would you be able to tell me whether the object is speeding up or slowing down? If not, what further information would you require?
- The motion sensors measure only the position of the cart at regular time intervals. How then does the software arrive at the velocity and acceleration data?
- You will want to convince your lab instructor that the position, velocity and acceleration graphs are consistent with each other. (How will you do it? The slope tool perhaps?
 Additionally, if you select a data point and click the left icon which appears, the coordinates will be displayed on the screen).