Type A Theory Exercise 4: Width of the Probability Density Function
Exercise 4: Width of the Probability Density Function
A probability density function is typically characterized by two variables: an average and a width. The average is intuitive (it’s the middle!) but defining the width needs some thought…
These are the common PDFs that we looked at in the previous exercise:
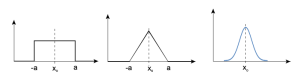
a) How would you define the “width” of the functions?
Clearly the Gaussian function is the most difficult to deal with since it never goes to zero. The “width” is then typically measured by its standard deviation, σ. BUT, it is important to recognize that the range, xo ± σ, does not encompass all possible values of x. In fact, the probability of an individual value being in the range ± σ is about 68%. (Does all of this sound familiar?)
Because random uncertainty, with its Gaussian function description, is such an important feature of data analysis, we choose to define the widths of the other functions using a similar definition, namely that instead of covering the entire range of possible values, they will only cover some large fraction. How large a fraction? That will depend on the probability density function. A summary is provided below:
For future reference you can find this information in the Table of Probability Density Functions in the Appendix.
How does this interpretation of the width of a PDF affect the reporting of scale and meter readings (what we previously called Type B evaluation)?
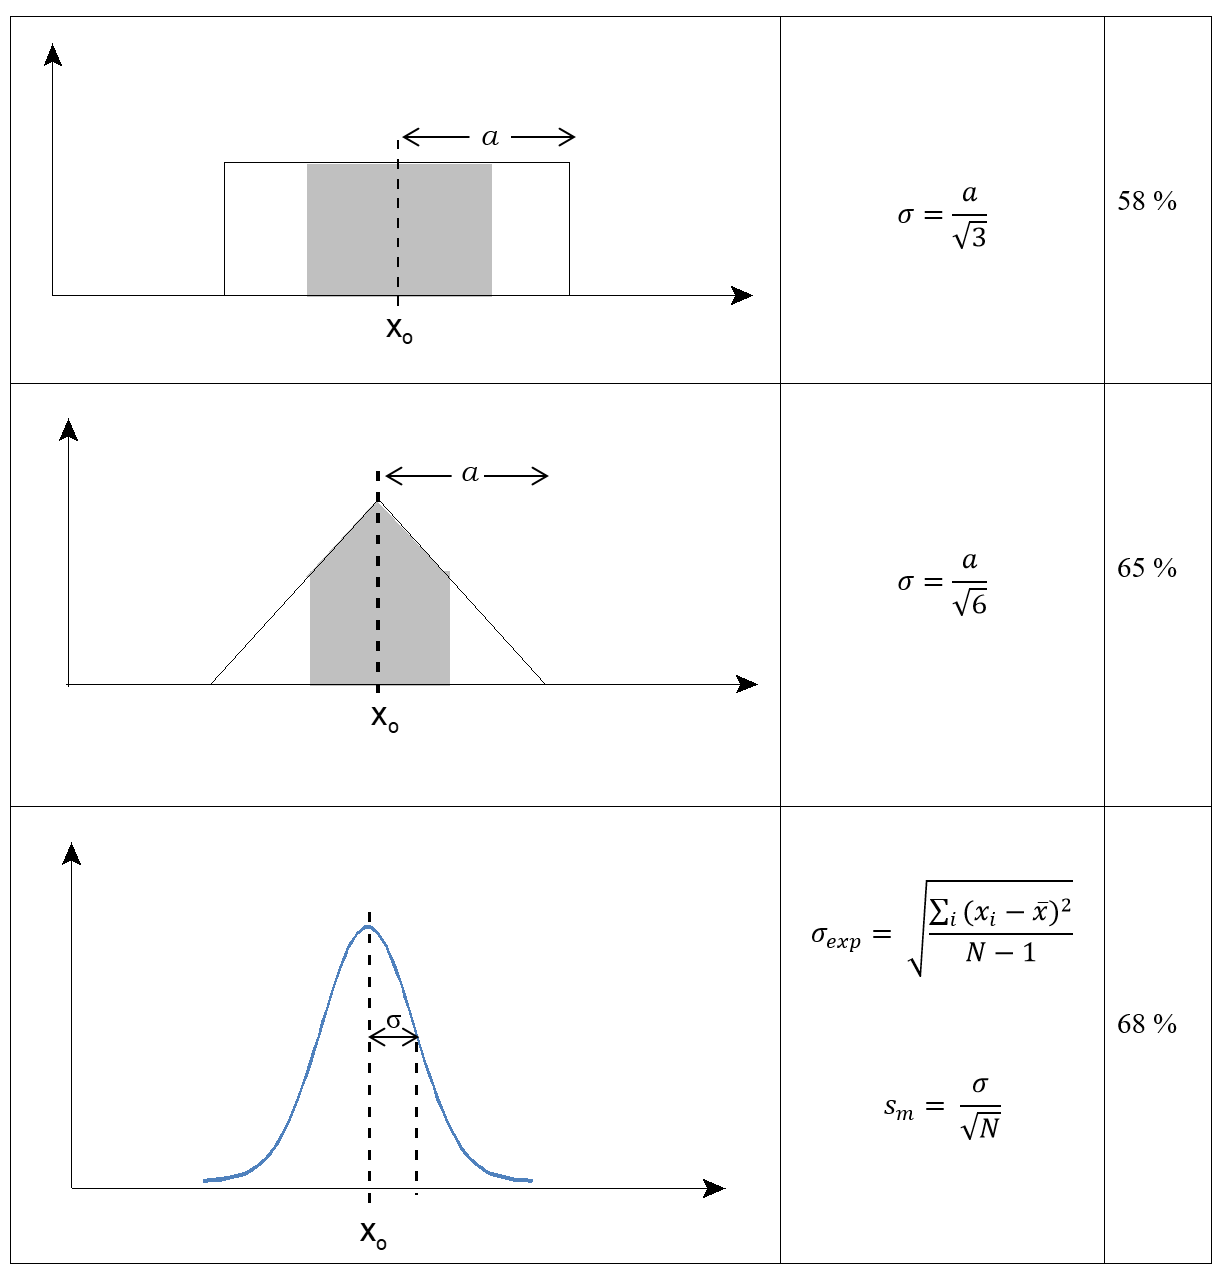
b) In the Type B evaluation lab, we might have reported the scale measurement as
m = 2.20 ± 0.05 g
where 0.05 is the maximum deviation from the centre of the range. Now, we recognize, that the measurement is best described by a rectangular PDF. The standard uncertainty, σ, for a rectangular PDF is given in the table. From now on, we would report the result of the measurement as…
m =
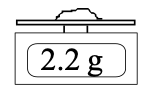
c) In the Type B evaluation lab, we measured the position on the ruler as
d = 44 ± 1 cm
This measurement might be better described by a triangular PDF. Consulting the table, we would report the result of this measurement as…
d =
You might have guessed that, if we were going to choose a width for the triangular and rectangular distributions to be consistent with the Gaussian function, that those widths would cover 68% of the possible values. They don’t. The definition is actually deeper. σ2 is the variance of the normalized Gaussian function, technically defined as
[latex]\Large{\sigma^2 = \int_{-\infty}^{\infty} x^2G(x) \ dx}[/latex]
If you were to do the integral for the rectangular and triangular functions, you would obtain the values of σ given in the table.