Type A Expmt Part 1 Exercise 2: Standard Uncertainty on the Mean
In the previous exercise, you looked at the results of a repeated measurement and calculated an average and a standard uncertainty. But what does the standard uncertainty represent? Specifically, is it the uncertainty on the average?
Exercise 2: Standard Uncertainty on the Mean Experiment
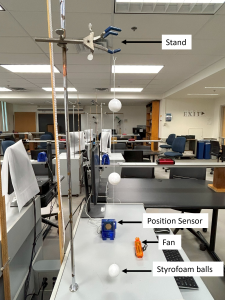
2.1 For this experiment, you will need
- a triple pendulum made of three styrofoam balls connected by a string
- a small battery operated fan to provide random air movement
- a motion sensor and Capstone software
Open the Capstone experiment file called “Triple Pendulum".
The first page, “Example Data Page,” contains a sample of the data you will be taking. Take a look at the graph and how the data is collected and sorted. You will be taking your data sets in a moment.
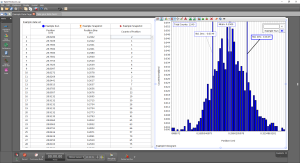
The data points are sorted in columns on the left of the window. The first column contains all the individual data points. The second column shows the different ‘bins’ which data is sorted into. The right most column shows a count of how many data points are in each bin.
The graph shows the data in columns, which are the bins. Try increasing and decreasing the bin size to see how the graph changes using these buttons ![]() . You may have to rescale the graph to see it properly using this button
. You may have to rescale the graph to see it properly using this button ![]() .
.
—
Now you can begin taking your own data. First ensure the set up is correct. The sensor should be in line with the lowest ball. It should also be around 30 cm away from the ball. Ensure the sensor is in the correct mode (stick figure option on the sensor).
Navigate to the second page on the capstone software, “Take your data here!”. Try taking a practice run of data. See how the graph populates with your new data in real time.
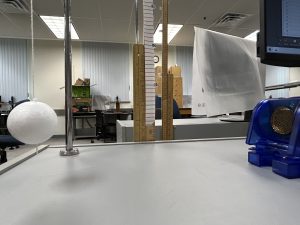
For your actual data, you will record the position of the ball while your fan is used to randomize its movement. Use the fan to blow on the top most ball for the most random movement, as in this video example:
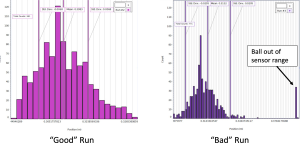
A “good run” will have 800 or more data points (this is about one minute of data recording), and will not have outliers. If your ball moves out of the line of sight of the sensor, it may pick up objects behind it and record unwanted distance measurements. Practice a few times and see what works best!
When you have a good run, you will need to create a ‘snapshot’ of it for the table. Make sure the good run is selected, then press this button ![]() .
.
Select the snapshot you just took for the second and third column (you may need to scroll to the top of the table to see the columns populate).
Note: the snapshot number will not necessarily match the run number - make sure you know which run corresponds to which snapshot!
In an Excel file, summarize the mean, standard deviation, and number of data points information that you obtain for your first good run.
2.2 Now repeat the experiment two more times so that you have three runs. Ensure each group member gets at least one good run. Make sure that the runs you are using do not have data from the ball being out of range of the sensor as this skews the results significantly.
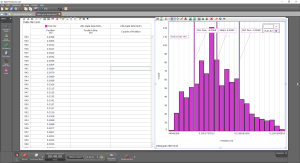
You can view multiple data sets at once on the graph using this button ![]() . Select your three good runs and note each standard deviation, and mean
. Select your three good runs and note each standard deviation, and mean ![]() .
.
In an Excel file, summarize the mean, standard deviation, and number of data points information that you obtain for each three runs.
a) Compare the mean values for the ball's position. How big are the differences between these mean values?
b) Compare the standard deviations for the three runs. Are they similar? How many, of the 3 ranges you calculated, overlap? How do the standard deviation sizes compare to the differences in the mean values for the ball's position?
c) Based on your experiments, do you think that the standard deviation is a good estimate for the uncertainty on the mean value? Why or why not?
2.3 You likely noticed that the standard deviation, [latex]s[/latex], varied quite a bit between runs, and also that it was larger than the differences between the mean values of the ball's position. The uncertainty on the average should be smaller than the standard deviation of one data set, but how much smaller? Statistically, you can estimate the uncertainty on the average i.e. the standard uncertainty on the mean, [latex]s_m[/latex], as
[latex]\large{s_m = \frac{s}{\sqrt{N}}}[/latex] (1)
where [latex]s[/latex] is the random uncertainty on each measurement, and [latex]N[/latex] is the number of times that you repeated the measurement.
a) Calculate [latex]s_m[/latex] from equation (1) for each of the runs in your Excel file.
b) How many of your mean values for the ball's position agree with each other within the standard uncertainty on the mean?
c) Do you expect the mean values to agree within the standard uncertainty on the mean all of the time? If not, how often (statistically), should they agree?