Type A Expmt Part 1 Exercise 3: Gaussian PDF
Exercise 3: Gaussian PDF
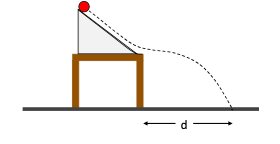
You are doing an at-home experiment on projectile motion to measure how far a ball which has been rolled down a ramp will travel horizontally. Your setup looks something like the schematic shown in the diagram. You start the ball from a marked position on the ramp and release it from rest. You then use a ruler to measure how far it lands from the edge of the ramp. You have access to paper that you can put on the floor that will mark when the ball hits it, which gives you a helpful visual aid for your measurements.
After your first couple of practice runs, you notice that there is significant dispersion on the measured distance regardless of how carefully you line up the ball with the mark on the ramp. You decide that you need to repeat the measurement many times to assess the feasibility of the experiment. These are your results:
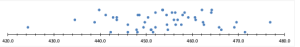
Based on these results you think that this data may be modelled reasonably well by a Gaussian function. In the next few steps you will explore this.
a) The data is provided to you in an Excel file. In the “Data” Sheet you’ll find the measurements in column A. Columns E through J contain the frequency table.
|
Bin min… |
…Bin max |
Number of readings |
Relative Frequency |
|
|
|
in the bin |
|
|
420.0 mm |
424.9 mm |
1 |
.02 |
|
425.0 mm |
429.9 mm |
0 |
0 |
|
430.0 mm |
434.9 mm |
1 |
.02 |
|
435.0 mm |
439.9 mm |
2 |
.04 |
|
· |
· |
· |
|
|
· |
· |
· |
|
|
· |
· |
· |
|
|
475.0 mm |
479.9 mm |
1 |
.02 |
For this example we chose a bin “width” of 5 mm. Can you give a possible reason why this is a more appropriate choice than 1 mm or 20 mm for this data set?
b) Calculate the average and the standard uncertainty of your data (use =AVERAGE() and =STDEV() excel functions on the data in column A to calculate these!). What is the standard error on the mean?
c) Calculate p0 and write down the Gaussian PDF expression. Remember from Lab 8 that [latex]p_0 = 1/ (\sigma \sqrt{2 \pi})[/latex] and the Gaussian equation is [latex]p(x) = p_0 e^{-\frac{1}{2}(\frac{x-x_0}{\sigma})^2}[/latex].
d) On the “Gaussian” Sheet of the Excel file, you can compare your measured data to the Gaussian function. Copy your frequency data into column B. (Highlight the frequency data on sheet 1, right click for the menu and choose copy. Then move your cursor to cell B3 of sheet 2, right click for the menu, and paste special, values.) Fill in your calculated values of p0, x0, and σ to create the Gaussian function. How does it compare to the experimental distribution?