Exercise 4: Understanding friction as a function of applied force
Exercise 4.1 (2 marks)
Compare your coefficient of static friction (µs) and kinetic friction (µk), which one is bigger? Does this make sense? Explain why or why not in 2-3 sentences.
Exercise 4.2 (1 mark)
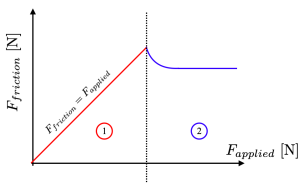
The graph below shows the force of friction as a function of applied force for a shoe on a ramp. Consider the scenario where the applied force increases steadily from zero, moving left to right along the x-axis. Describe what is happening in region 1 and region 2, which are separated by the dotted line. Pick the correct option(s) directly on Crowdmark.
Exercise 4.3 (1 mark)
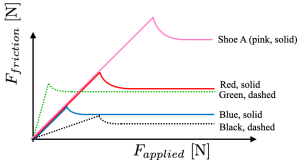
Now imagine that you perform the same experiment (where the applied force is increasing, moving from left to right along the plot) with a second shoe. Let ‘Shoe B’ have the same static and kinetic friction coefficients but have half the mass as ‘Shoe A’. In the graph below, ‘Shoe A’ is represented by the solid pink curve. Which curve represents the force of friction as a function of applied force for ‘Shoe B’? Pick the correct option(s) directly on Crowdmark.
Before you continue!
Before continuing, be sure you have completed (4.1), (4.2), and (4.3), which will be graded and submitted through Crowdmark.
