Exercise 2: Collecting data
For this experiment you will need to collect the following items:
- Bouncy ball
- Ensure that the ball can bounce many times when dropped onto a surface (a minimum value is stated as you go through the exercise). Additionally, its collision with the surface should also be loud enough for an audio recording device to pick up (e.g. small rubber ball, basketball, volleyball, soccer ball, etc.).
- Measuring tape
- A device to record an audio track, such as a phone or a laptop
- A device which can use an audio visualiser (Audacity, iMovie, Voice Notes, etc.)
- A towel or something similar to make the floor ‘softer’
Procedure:
The following experiment will be performed twice. You will use the same ball both times, but change the ‘ground’ material. In the first experiment, use a smooth, flat, and hard surface (countertop, a dense table, hard floor, etc). In the second experiment, use a piece of cardboard or cloth (t-shirt, tea towel, etc.) on top of your smooth, hard surface. Before your begin, think about what differences there may be between your results.
Measure a height of about 1 m above the surface that you will be using in your experiment.
Record an audio track that captures the bouncing of your ball (see the instructions Finding the time between collisions below). You will be using the length of time between collisions (bounce time) to calculate the energy loss, so be sure you are able to collect precise data. To help you in your data collection, try to reduce background noise as best you can.
Using your recording, obtain the time at which each collision happened and record it in the table of results found after Exercise 2.1. Try to measure at least 6 bounces (7 collisions with the ground).
Repeat the experiment for the second ground material. Try to measure at least 4 bounces (5 collisions with the ground). You should notice that on the hard surface there are more bounces and the ball bounces higher than on a soft surface (i.e. with the cardboard or cloth layer). You may realize that this is because the ball loses more mechanical energy on the soft surface than on the hard surface. The collision on the hard surface is closer to a perfect elastic collision.
Finding the time between collisions
In Lab 1, you used a video recording to make precise height measurements. In this lab, we are concerned with the time between bounces (collision with the ground). Since we don’t need to see the ball at all, we can use an audio recording to obtain very precise data. Just like video, an audio recording can be thought of as a series of sound ‘snapshots’. That is, digital audio recordings are not continuous and are made of many tiny audio samples taken over short periods of time. You can think of a single sample as a single frame. When all of the samples are played back-to-back, you will hear an accurate reproduction of the real sound (provided enough samples are taken per second).
As described in Lab 1, your phone camera likely records about 30 frames per second when taking a video. On the other hand, audio is sampled at a much higher rate. This is for physiological reasons (the human eye can process about 10-12 frames per second as separate images – everything else appears as motion) as well as technical reasons (images require much more storage than audio). However, audio requires a much higher sampling rate to sound realistic. For this reason, you should be able to precisely record your bounces as this corresponds to the peaks in your recording.
There are a variety of ways to visualize your audio track’s ‘waveform’ outlined in the Resources section.
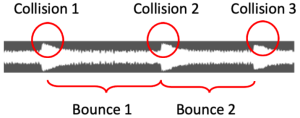
An example of a waveform with 3 collisions and 2 bounces is shown in Figure 2.1 below. Now you can use the spacing between peaks to determine ∆t!
Exercise 2.1 (3 marks)
Submit a photograph of your experimental set-up, with the student card(s) of all group member(s) participating in this lab clearly visible.
Secondly, provide an additional image of the student cards used in the previous photo. Here, the student name(s) and student number(s) must be legible. With your experimental set up in the background, you may take this image from a closer view to ensure the student card(s) is/are in full focus. Note: you do not need to be in the photo. If you are completing this lab with others virtually, you may provide a screenshot of your video call, with the student cards of all members visible. Your experimental set up must still be visible in the background.
Lastly, provide a screenshot of your audio waveform.
The link to download the Excel file that you may use for this Exercise is found below.
![A 13 by 6 table with an extra cell at the top where you are prompted to fill in what surface you used. For the table below, the first row reads: collision, time [s], time between collisions delta t [s], v0 [m/s], K / m = 1/2 v0^2 [J/kg], coefficient of restitution e. Only the collision column is filled in, with the values in this column spanning from 1 to 12 in ascending order. The cells of column 3, 4, 5, and 6 are shifted down by half the height of a cell.](https://ecampusontario.pressbooks.pub/app/uploads/sites/3307/2025/01/1A03-Lab-3-Updated-1-1-3-264x300.png)
Note: You should be filling in the first two columns of the results table with your waveform data. The last two columns, (v0, and K/m) will be calculated in the next section.
Now that you know how long the ball is in the air between collisions, you can use the equation you derived in Exercise 1.2 to calculate the speed of the ball as it leaves the ground, v0. Then, you can use this speed to calculate the kinetic energy of the ball as it leaves the ground for each bounce, [latex]K = \frac{1}{2}m(v_0)^2[/latex]. However, you’ll notice we have asked you to calculate K /m. This is for a few reasons. First, since you use the same ball for all experiments, so mass, m is a constant throughout the lab. This means that if K changes by some amount, we know the change represents a change in speed only. Additionally, since we don’t know the exact value of m, dividing K by m means you can obtain a numerical result that does not depend on m.
Exercise 2.2 (4 marks)
Calculate v0 and K/m, then fill in the next two columns of your chart. Submit your completed charts for both surfaces. Ensure that you label the surface used on the top left of each chart.
Note: you will not be able to get as many bounces with the soft surface as with the hard surface, this is okay. Aim to get at least 5 collisions with the ground using the soft surface and at least 7 with the hard surface (more is better).
Before you continue!
Before continuing, be sure you have completed (2.1) and (2.2), which will be graded and submitted through Crowdmark.
