Exercise 2: Ball Drop
For this experiment you will need the following items:
- A measuring device (ideally a measuring tape, but you can tape sheets of paper together and put markings on it as well).
- An object to drop (e.g. a marble, small ball, battery, a grape, or any similar object).
- A video recording device (a smartphone is ideal).
- QuickTime Player, Windows Media Player, Media Player classic, or any program that can view videos frame-by-frame (see the Frame-by-Frame Analysis for help).
Procedure:
Measure a distance of [latex]d = 1[/latex] [latex]m[/latex] from the floor along a wall. Note: we define the upwards direction as positive. We also place the origin at [latex]d = 0[/latex] [latex]m[/latex], which is at floor level. In the next step you will be dropping the object from a height of [latex]d = 1[/latex] [latex]m[/latex].
Think about it:
Would it matter if we set down as the positive direction? Further, does it matter if we set the origin as where we drop the object from?
Now, set up your video recording device to capture the object as it falls from [latex]d = 1.0[/latex] [latex]m[/latex] to [latex]d = 0[/latex] [latex]m[/latex] (see video below). You will need to measure the position of the object as it is falling. In order to do this, you can use a measuring tape, or instead you can mark every [latex]0.05[/latex] [latex]m[/latex] or [latex]0.10[/latex] [latex]m[/latex] on the wall. By recording the ball as it drops beside the markings, you can obtain the object’s position.
You may find it useful to follow the video below where Sara marks positions on the wall and drops objects from a height of 1.0 m.
When you play back your video, you may find that the object moves too fast to make a clear position measurement and that the time it takes to fall is short. However, if you pause the video, you can observe a (possibly blurry) image of your object near one of your markings. Though the images may be blurry, comparing the location of your object to your markings will allow you to make adequate position measurements.
Videos are just a collection of still images taken in quick succession with a constant time between each image. The number of images your camera takes per second is known as the “frame rate” and is reported in frames-per-second (fps). In order to obtain the position of the object as a function of time, you will take advantage of the fact that most cameras record video at a constant frame rate to make your time measurements.
In order to make the measurements, you will need to be able to view the video frame-by-frame. This can be done in many ways, depending on the device you are using. See Frame-by-Frame Analysis for details on how to view and analyze videos. Additionally, you may use this guide to help determine the frame rate of your video for the analysis. Most smartphones will either display the frame rate before recording, or have the information accessible under the properties of the video.
Exercise 2.1 (2 marks)
Provide a picture of your experimental set-up that clearly shows the measuring device (i.e. measuring tape), dropped object, and the student card(s) of the participating member(s) in this lab.
Secondly, provide an additional image of the student card(s) used in the previous photo. Here, the student name(s) and student number(s) must be legible. With your experimental set up in the background, you may take this image from a closer view to ensure the student card(s) is/are in full focus. Note: you do not need to be in the photo. If you are completing this lab with others virtually, you may provide a screenshot of your video call, with the student cards of all members visible. Your experimental set up must still be visible in the background.
Exercise 2.2 (3 marks)
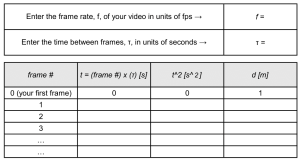
Use your video to complete the table below (found in the same Excel sheet from Exercise 1). Frame # is the frame number starting at 0, t is the time since the drop in seconds (s), τ is the time between frames and d is the position in meters (m). Make sure to count your first frame as frame number zero.
Helpful hints:
i) Be sure to report your answers in SI units.
ii) You can use the chart provided in Exercise 1, or you can make a new chart on any spreadsheet software you wish to use, or manually on paper, as long as it is clear in the image you submit.
iii) Since you will be recording data from d = 1.0 m until d = 0 m. Aim to have between 10-20 frames in your table in order to accurately see the trend. Depending on your frame rate, you may not need to record data on each consecutive frame (if you opt to record every other frame, ensure this is consistent for your entire analysis).
iv) When calculating your value of τ, reflect on its units and relationship to fps.
Think about it:
Ask yourself if the calculated time it took your object to fall makes sense. Does this roughly line up with the length of your video?
Exercise 2.3 (3 marks)
Use the data obtained in your chart to make the following two graphs (manually on graph paper or using any plotting/spreadsheet software of your choosing):
i) Graph position of the object, d, as a function of time, t
ii) Graph position of the object, d, as a function of time squared, [latex]t^2[/latex]
Have a careful look at Warm-up Exercise 3. In that exercise you used the kinematic equation:
[latex]d = d_0 + v_0t + \frac{1}{2}at^2[/latex]
Now think about how this applies to the graphs you made and which one is linear.
Draw or fit a best fit line to the linear graph (hint: only one of the two graphs you created should be linear) and submit this linear graph with the best fit line included. Only submit the linear graph. Please see the Excel Help page and Helpful Graphing Tips found in the appendix as a guide.
Exercise 2.4 (3 marks)
Making sure to include proper units, calculate:
i) The slope of the best fit line to the linear graph
ii) The acceleration of your object during free-fall (acceleration is a vector!)
Hint: The most accurate way to calculate the acceleration is from your linear graph – how does the slope relate to acceleration? Keep in mind it is not equal but it is proportional.
iii) Finally, we know that objects in free-fall have an acceleration due to gravity of 9.8 m/s2 [down]. Does the value you obtained agree with this? Why or why not?
Before you continue!
Before continuing, be sure you have completed Exercises 2.1 to 2.4 on Crowdmark for grading.
