Exercise 1: Proportionality
Let’s begin with the following relationship between the variables U, Q, and P (note: 6 and 𝛑 are constants).
[latex]U^2 = \frac{6P^2}{\pi Q}[/latex]
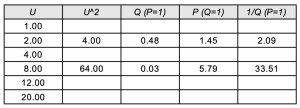
Fill in the values of the table below. Note that in each column, only one variable changes, while the other variables are held constant. For simplicity, we set the third variable equal to one. This is indicated in the brackets. We have completed two of the rows to help you check your work.
Below is the link to download the Excel file that you may use for Lab 1 (for Exercise 1 and Exercise 2). The first tab includes the table for Exercise 1 (seen above), while the second tab has the table you will be using for Exercise 2. You can also use any other spreadsheet and graphic software if you’d prefer.
Exercise 1.1 (3 marks)
Using your table of values above, create a plot of:
- [latex]P[/latex] vs [latex]U[/latex]
- [latex]P[/latex] vs [latex]U^2[/latex]
- [latex]1/Q[/latex] vs [latex]U^2[/latex]
When we say (something) vs. (something), this means y (vertical) vs. x (horizontal).
Note: you can create these plots using whichever method you prefer. Graphing software or hand drawn graphs on graph paper are acceptable, and make sure to look at the graphing appendix to remind yourself what we are looking for in submitted graphs. Make sure to label your axes, and do not connect your data points. These variables do not have units.
Visit the Excel Help if you need a reminder on how to upload a graph from excel. Please do not submit a photo of your screen taken from a separate device.
Exercise 1.2 (2 marks)
Which plot(s) from 1.1 is/are linear? Choose all correct answer(s) on Crowdmark.
a. [latex]P[/latex] vs [latex]U[/latex]
b. [latex]P[/latex] vs [latex]U^2[/latex]
c. [latex]1/Q[/latex] vs [latex]U^2[/latex]
Exercise 1.3 (2 marks)
If [latex]U[/latex] is held constant (i.e. [latex]U = 1[/latex]), which graphing relationship(s) between [latex]P[/latex] and [latex]Q[/latex] would yield a straight line (i.e. the graph would be linear)? Choose all correct answer(s) on Crowdmark.
a. [latex]P[/latex] vs [latex]Q[/latex]
b. [latex]P[/latex] vs [latex]Q^2[/latex]
c. [latex]P^2[/latex] vs [latex]1/Q[/latex]
d. [latex]P[/latex] vs [latex]\sqrt{Q}[/latex]
e. [latex]P^2[/latex] vs [latex]Q[/latex]
Before you continue!
Be sure you have completed Exercises 1.1, 1.2, and 1.3 on Crowdmark for grading. But before heading to the next exercise, ask yourself how understanding the proportionality between variables can be useful.
