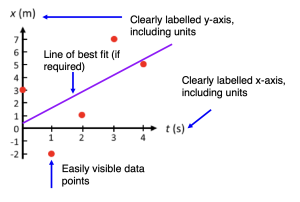
Creating Good Graphs
Each graph you submit should have clearly labelled axes, with units, clear data points, and if required, a line of best fit. Do not connect your data points. See below for an example of the graph of time (t) vs. position (x). Note the labelled portions with blue arrows that a TA will be looking for when grading your graphs.