Exercise 4: Understanding friction as a function of applied force
Exercise 4.1 (2 marks)
Compare your coefficient of static friction (µs) and kinetic friction (µk), which one is bigger? Does this make sense? Explain why or why not in 2-3 sentences.
Use the form below to submit your values of mu to add to the class data set. We are interested to see the distribution of values obtained by students taking Physics 1A03, there are no ‘right’ or ‘wrong’ answers.
Exercise 4.2 (1 mark)
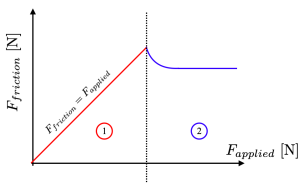
The graph below shows the force of friction as a function of applied force for a shoe on a ramp. For the scenario where the applied force increases steadily from zero; moving left to right along the x-axis, describe what is happening in region 1 and region 2. Pick the correct option directly on Crowdmark.
Exercise 4.3 (1 mark)
Before you continue!
Before continuing, be sure you have completed (4.1), (4.2), and (4.3), which will be graded and submitted through Crowdmark.
