4.5 Polygenic Disorders
Phenotype Variability
The phenotypes described thus far correlate nearly perfectly with their associated genotypes. In other words, an individual with a particular genotype always has the expected phenotype. However, most phenotypes are not determined entirely by genotype alone. Instead, they are determined by an interaction between genotype and environmental factors and can be conceptualized in the following relationship:
Genotype + Environment
⇒ Phenotype (G + E ⇒ P)
Or:
Genotype + Environment + InteractionGE
⇒ Phenotype (G + E + IGE ⇒ P)
*GE = Genetics and Environment
This interaction is especially relevant in studying economically important phenotypes, such as human diseases or agricultural productivity. For example, a particular genotype may predispose an individual to cancer, but cancer may only develop if the individual is exposed to certain DNA-damaging chemicals or carcinogens. Therefore, not all individuals with a particular genotype will develop the cancer phenotype; only those who experience a particular environment will. The terms penetrance and expressivity are also helpful to describe the relationship between certain genotypes and their phenotypes.
Penetrance
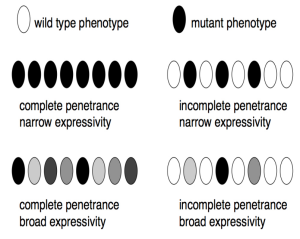
Penetrance is the proportion of individuals with a particular genotype that display a corresponding phenotype (see figure below). It is usually expressed as a percentage of the population. Because all pea plants are homozygous for the allele for white flowers, this genotype is entirely (100%) penetrant. In contrast, many human genetic diseases are incompletely penetrant since not all individuals with the disease genotype develop symptoms associated with the disease (less than 100%).

Expressivity
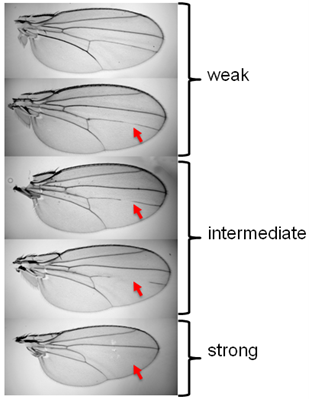
Expressivity describes the variability in mutant phenotypes observed in individuals with a particular phenotype (see figure below). Many human genetic diseases provide examples of broad expressivity since individuals with identical genotypes may vary significantly in the severity of their symptoms. Incomplete penetrance and broad expressivity are due to random chance, non-genetic (environmental), and genetic factors (mutations in other genes).

Concept in Action
Watch the video Penetrance vs. Expressivity (3 mins) by The Excel Cycle (2020) on YouTube which discusses the difference between expressivity and penetrance.
Video source: The Excel Cycle. (2020, June 6). Penetrance vs. Expressivity [Video]. YouTube. https://www.youtube.com/watch?v=nurrFUIDBHc
Read
Wright, F., & Fessele, K. (2017). Primer in genetics and genomics, article 5 further defines the concepts of genotype and phenotype and explores genotype-phenotype associations. Biological Research for Nursing, 19(5), 576–585. https://doi.org/10.1177/1099800417725190
Genotype as a predictor for the development of disease
This unit taught us that our genotype can predispose us to disease development, but multiple factors influence it, including polygenic contributions and epigenetic mechanisms. While some individuals may inherit genetic variants that increase susceptibility, the expression of these genes can be significantly modified by epigenetic changes, which are often influenced by environmental and lifestyle factors.

Usually, no one-to-one correspondence between a gene and a physical characteristic exists. Often, a gene is responsible for several phenotypic traits and is said to be pleiotropic. Pleiotropy occurs when one gene influences two or more seemingly unrelated phenotypic traits. Such a gene that exhibits multiple phenotypic expression is called a pleiotropic gene. For example, mutations in Drosophila’s vestigial gene (vg) result in an easily visible short-wing phenotype. However, mutations in this gene also affect the number of egg strings, the position of the bristles on the scutellum, and the lifespan of Drosophila. Therefore, the vg gene is said to be pleiotropic in that it affects many different phenotypic characteristics. During his study of inheritance in pea plants, Mendel made several interesting observations regarding the colour of various plant components. Specifically, Mendel noticed that plants with coloured seed coats always had coloured flowers and coloured leaf axils — axils are the parts of the plant that attach leaves to stems. Mendel also observed that pea plants with colourless seed coats always had white flowers and no pigmentation on their axils. In other words, in Mendel’s pea plants, seed coat colour was always associated with specific flower and axil colours. We know that Mendel’s observations resulted from pleiotropy, or the phenomenon in which a single gene contributes to multiple phenotypic traits. In this case, the seed coat colour gene, denoted a, was responsible for seed coat colour and flower and axil pigmentation.
On the other hand, single characteristics can be affected by mutations in multiple, different genes. This implies that many genes are needed to make each characteristic. For example, if we return to the Drosophila wing, there are dozens of genes that, when mutant, alter the normal shape of the wing, not just the vg locus. Thus, many genes are needed to make a normal wing; the mutation of any one causes an abnormal, mutant phenotype. This type of arrangement is called polygenic inheritance.

What are complex or multifactorial disorders?
Researchers are learning that nearly all conditions and diseases have a genetic component. Some disorders, such as sickle cell disease and cystic fibrosis, are caused by variants (also known as mutations) in single genes. The causes of many other disorders, however, are much more complex. Common health problems such as heart disease, type 2 diabetes, and obesity do not have a single genetic cause—they are influenced by multiple genes (polygenic) in combination with lifestyle and environmental factors, such as exercise, diet, or pollutant exposures. Conditions caused by many contributing factors are called complex or multifactorial disorders.
Although complex disorders often cluster in families, they do not have a clear-cut inheritance pattern. Identifying the role of genetics in these disorders may be challenging, mainly because families often share environments and have similar lifestyles. This makes it difficult to determine a person’s risk of inheriting or passing on these disorders. Complex disorders are also difficult to study and treat because the specific factors that cause most of these disorders have not yet been identified. Researchers continue to look for major contributing genes for many common, complex disorders.
Continuous Variation
Most of the phenotypic traits commonly used in introductory genetics are qualitative. This means the phenotype exists in only two (or possibly a few more) discrete, alternative forms, such as purple or white flowers, or red or white eyes. These qualitative traits are, therefore, said to exhibit discrete variation. On the other hand, many interesting and important traits exhibit continuous variation, meaning they exhibit a continuous range of phenotypes that are usually measured quantitatively, such as intelligence, body mass, blood pressure in animals (including humans), and yield, water use, or vitamin content in crops. Traits with continuous variation are often complex, and do not show the simple Mendelian segregation ratios (e.g., 3:1) observed with some qualitative traits. The environment heavily influences many complex traits; nevertheless, complex traits can often have a heritable component, which must involve one or more genes.
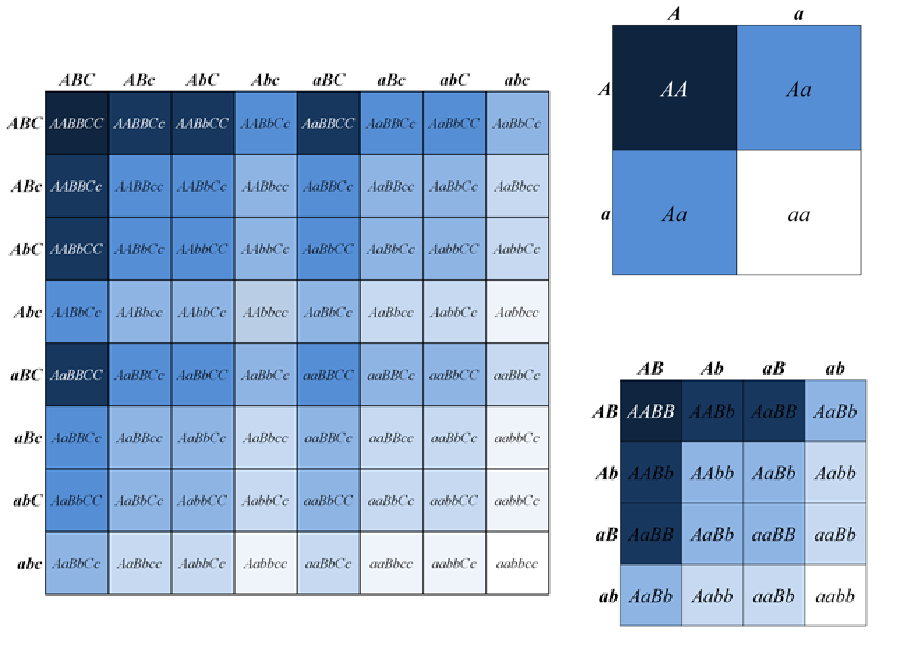
How can genes, which are inherited (in the case of a diploid) as, at most, two variants each, explain the wide range of continuous variation observed for many traits? The lack of an immediately obvious explanation to this question was one of the early objections to Mendel’s explanation of the mechanisms of heredity. However, upon further consideration, it becomes clear that the more loci that contribute to the trait, the more phenotypic classes may be observed for that trait (see figure below).

If the number of phenotypic classes is sufficiently large (as with three or more loci), individual classes may become indistinguishable (particularly when environmental effects are included), and the phenotype appears as a continuous variation (see figure below). Thus, quantitative traits are sometimes called polygenic traits, because it is assumed that the combined activity of many genes controls their phenotypes. Note that this does not imply that each of the individual genes has an equal influence on a polygenic trait — some may have a major effect, while others are only minor. Furthermore, any single gene may influence more than one trait, whether these traits are quantitative or qualitative traits.

Concept in Action
Watch the video, Polygenic Inheritance (13 mins) by AK Lectures (2015) on YouTube, which discusses the genetic basis of Polygenic Inheritance.
Video source: Andrey K. (2015, January 13). Polygenic inheritance [Video]. YouTube. https://www.youtube.com/watch?v=tKnOvPtwZL4
Attribution & References
Except where otherwise noted, this page is adapted from:
- 8.5 Environmental Factors In Introduction to Genetics by Natasha Ramroop Singh, Thompson Rivers University, CC BY-NC-SA 4.0
- 6.4 Pleiotropy vs. Polygenic Inheritance In Introduction to Genetics by Natasha Ramroop Singh, Thompson Rivers University, CC BY-NC-SA 4.0
- 8.4 Polygenic Inheritance In Introduction to Genetics by Natasha Ramroop Singh, Thompson Rivers University, CC BY-NC-SA 4.0
- What are complex or multifactorial disorders? In Help Me Understand Genetics by MedlinePlus, National Library of Medicine, Public Domain with attribution
References
Deyholos, M. (2017). Figures: 15. Punnett Squares for one, two, or three loci; and 16. The more loci that affect a trait… [digital images]. In Locke, J., Harrington, M., Canham, L. and Min Ku Kang (Eds.), Open Genetics Lectures, Fall 2017 (Chapter 26, p. 8). Dataverse/ BCcampus. http://solr.bccampus.ca:8001/bcc/file/7a7b00f9-fb56-4c49-81a9-cfa3ad80e6d8/1/OpenGeneticsLectures_Fall2017.pdf
Locke, J. (2017). Figures: 18. Relationship between penetrance and expressivity; and 19. Mutations in wings of Drosophila melanogaster… [digital images]. In Locke, J., Harrington, M., Canham, L. and Min Ku Kang (Eds.), Open Genetics Lectures, Fall 2017 (Chapter 26, p. 11). Dataverse/ BCcampus. http://solr.bccampus.ca:8001/bcc/file/7a7b00f9-fb56-4c49-81a9-cfa3ad80e6d8/1/OpenGeneticsLectures_Fall2017.pdf


