6.5 Calculating Probabilities Using Pedigree Charts
In practice, where available, model risk calculators are used. Examples include:
NCI (2024) Breast Cancer Risk Assessment Tool: Online Calculator (The Gail Model)
“The Breast Cancer Risk Assessment Tool (BCRAT), also known as The Gail Model, allows health professionals to estimate a woman’s risk of developing invasive breast cancer over the next five years and up to age 90 (lifetime risk)
The tool uses a woman’s personal medical and reproductive history and the history of breast cancer among her first-degree relatives (mother, sisters, daughters) to estimate absolute breast cancer risk-her chance or probability of developing invasive breast cancer in a defined age interval.
This calculator takes about five minutes to complete” (para 1).
The University of Cambridge (2024) CanRisk for Breast and Ovarian Cancer
“CanRisk is an online tool that enables healthcare professionals to calculate an individual’s future risks of developing breast and ovarian cancer using cancer family history, genetic and other risk factors. CanRisk also calculates variant carrier probabilities in breast and ovarian cancer susceptibility genes” (para 1).
MagView (2024). Tyrer-Cuzick Risk Assessment Calculator
“This risk calculator asks questions about your personal and family history to determine the possibility of developing breast cancer. The results will display your lifetime risk score. The purpose of this tool is simply to inform you” (para 1).
Pedigree analysis can also be used to calculate risk. If the mode of inheritance of a trait is known, we can use information about others in the family to calculate the likelihood that another individual will develop the trait. This is useful in situations like genetic counseling: if a couple comes to a genetic counselor due to a family history of a genetic disorder, what is the risk that their child will also suffer from the disorder?
If the mode of inheritance is known, it’s often possible to assign probable genotypes to some individuals in the pedigree, based on their phenotypes and relationships to others in the pedigree. For example, all individuals affected by an autosomal recessive trait have genotype “aa”, and any of their offspring who are unaffected by the trait must have genotype “Aa”. With this information, it’s then possible to calculate the probability of other individuals either having the allele (being unaffected carriers) or having kids with the trait. This makes pedigrees an important tool in genetic counseling if, for example, parents with a family history of a genetic disease would like to know the likelihood of passing the disease to their child.
Calculating risk from a pedigree chart
The rules of probability – and the laws of Mendelian inheritance – make these calculations possible. Remember from unit 2.5, we used two rules of probability: the product and sum rules. The product rule of probability states that the probability of two independent events occurring is the product of the probability of each event occurring independently. For example, in a cross between parents of genotypes Aa and Aa, the probability of having a child with phenotype A and a child with phenotype a is ¾ * ¼ = 3/8.
The sum rule of probability states that the probability of one event or another is the sum of their individual probabilities. In a cross between parents of genotypes Aa and Aa, the probability of having a child of genotype AA or Aa is ¼ + ½ = ¾.
In many of these complex family pedigrees, in order for a child to have a particular trait, the allele for the trait must be passed down from multiple individuals, often through several generations. But because all of these inheritance events must happen, we use the multiplication rule to calculate the combined probability.
When calculating the probabilities for a rare trait in the general population, unless there is evidence otherwise in the pedigree, we usually assume that unrelated individuals who are joining the family do not carry the same rare allele that “blood” relatives do, since this would be a pretty unlikely occurrence.
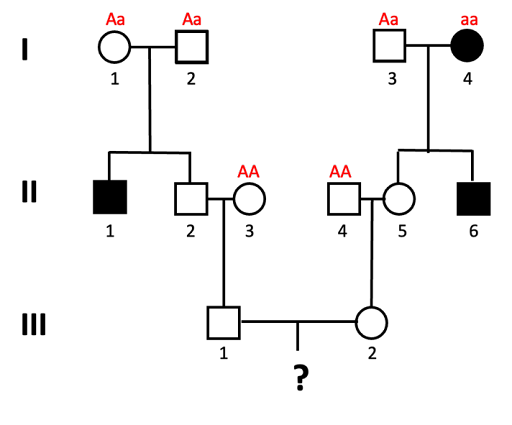
An example of this is shown using the pedigree shown in Figure 6.12. What is the probability that a child of III-1 and III-2 will be affected by the autosomal recessive trait?

We solve this type of problem by determining the genotypes of the direct ancestors to the individual for whom we will calculate the probability. The next figures walk through this process, step by step. Let’s assume the allele associated with the recessive trait is “a”.
Steps to determining the genotypes of direct ancestors
- We can assign genotypes to all of the individuals in generation I.
Individuals I-1 and I-2 must both have genotype Aa, since they have an affected child (II-1) who is presumed to have genotype aa. This is also true for individual I-3, who has a child with the trait as well. I-4 has the genotype aa, since they have the trait.
Figure 6.13 Pedigree used to calculate the probability of a child in the 4th generation having the autosomal recessive trait tracked in this family. Genotypes of all individuals in generation I are indicated: Aa, Aa, Aa, and aa. Source: Chromosomes, Genes, and Traits: An Introduction to Genetics, CC BY-SA 4.0. - Since this is a rare trait in the population, in Generation II we assume that individuals II-3 and II-4 do not carry the allele (they have genotype AA).

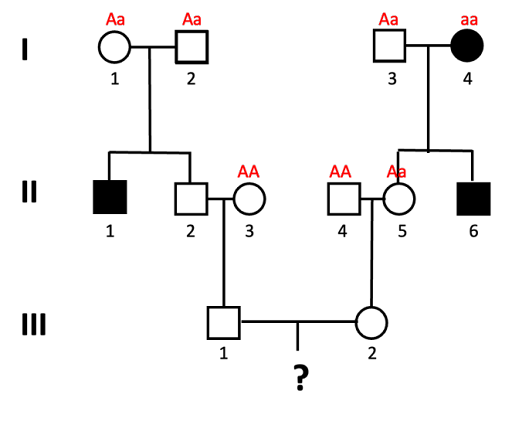
- Individual II-5 must have genotype Aa, since she inherits a dominant (unaffected) allele from her dad, but must inherit the recessive allele from mom.

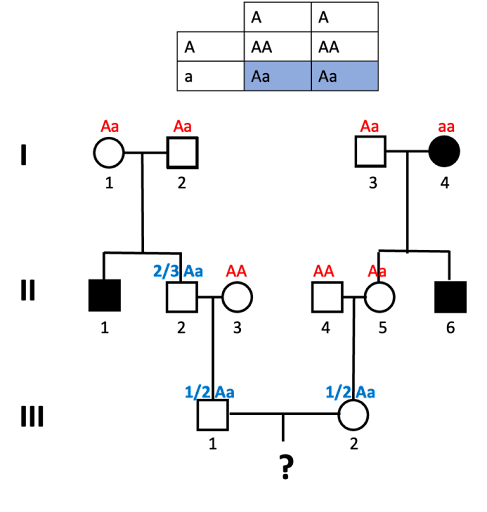
- What about individual II-2? In order for our final offspring to show the trait, individual II-2 must be a carrier of the “a” allele.
What’s the probability that they inherited the “a” allele? Well, let’s look at the Punnett Square expected from Aa x Aa parents (which is what individual II-2 has). This requires a bit of tricky reasoning: it might be tempting to say that ½ are Aa, but that is incorrect. We know that II-2 does not have an aa genotype because II-2 does not show the trait. Of the remaining possibilities, 2/3 are Aa.

- In generation III, we likewise need to determine the probability of III-1 and III-2 carrying the allele. We do this as we did for II-2: we draw a Punnett square to illustrate the cross, and determine which fraction of offspring carry the allele. For both III-1 and III-2, there is a ½ probability that they will carry the allele (and have the Aa genotype).

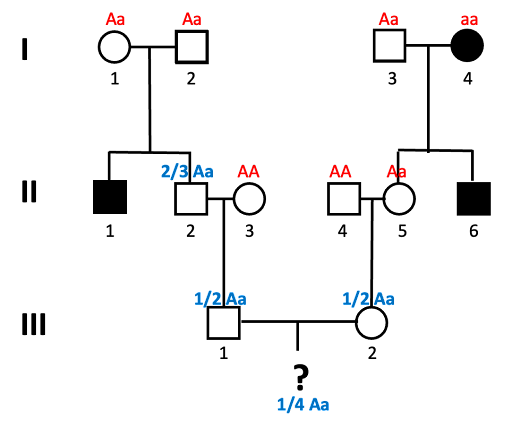
- Lastly, we can’t forget the child! A Punnett square of Aa x Aa shows that there is a ¼ chance of aa offspring.

In order for the child of III-1 and III-2 to show the trait, all these four things shown in blue in the images must be true: II-2 must be Aa, III-1 must be Aa, III-2 must be Aa, and the child must be aa. We use the multiplication rule to determine the overall probability:
2/3 * 1/2 *1/2 * 1/4 = 2/48
Some things to keep an eye out for, as you solve these problems: it’s very common to forget the last step: the probability of the final offspring showing the trait! Don’t forget to do this, even if there isn’t a symbol representing the unborn child. And watch out for those Aa x Aa crosses, where you can rule out aa as a possible genotype. 2/3 of the possible unaffected offspring are Aa, not ½.
Practice exercises are provided in the next unit.
Attribution & References
Except where otherwise noted, this section is adapted from Pedigree Analysis In Chromosomes, Genes, and Traits: An Introduction to Genetics, by Amanda Simons, Framingham State University, CC BY-NC-SA 4.0
References
MagView. (2024). Tyrer-Cuzick risk assessment calculator. https://ibis-risk-calculator.magview.com/
National Cancer Institute (NCI). (2024). Breast cancer risk assessment tool: Online calculator (The Gail Model). NIH. https://bcrisktool.cancer.gov/
The University of Cambridge. (2024). CanRisk for breast and ovarian cancer. https://www.canrisk.org/

