6.3 Constructing a Pedigree Chart
Taking and drawing a family history
Asking a patient about their family’s medical history is a familiar scenario for most healthcare professionals. In nursing school, the formal process of recording this information is taught. The production of a family history diagram, sometimes referred to as a genogram, is an example of this.
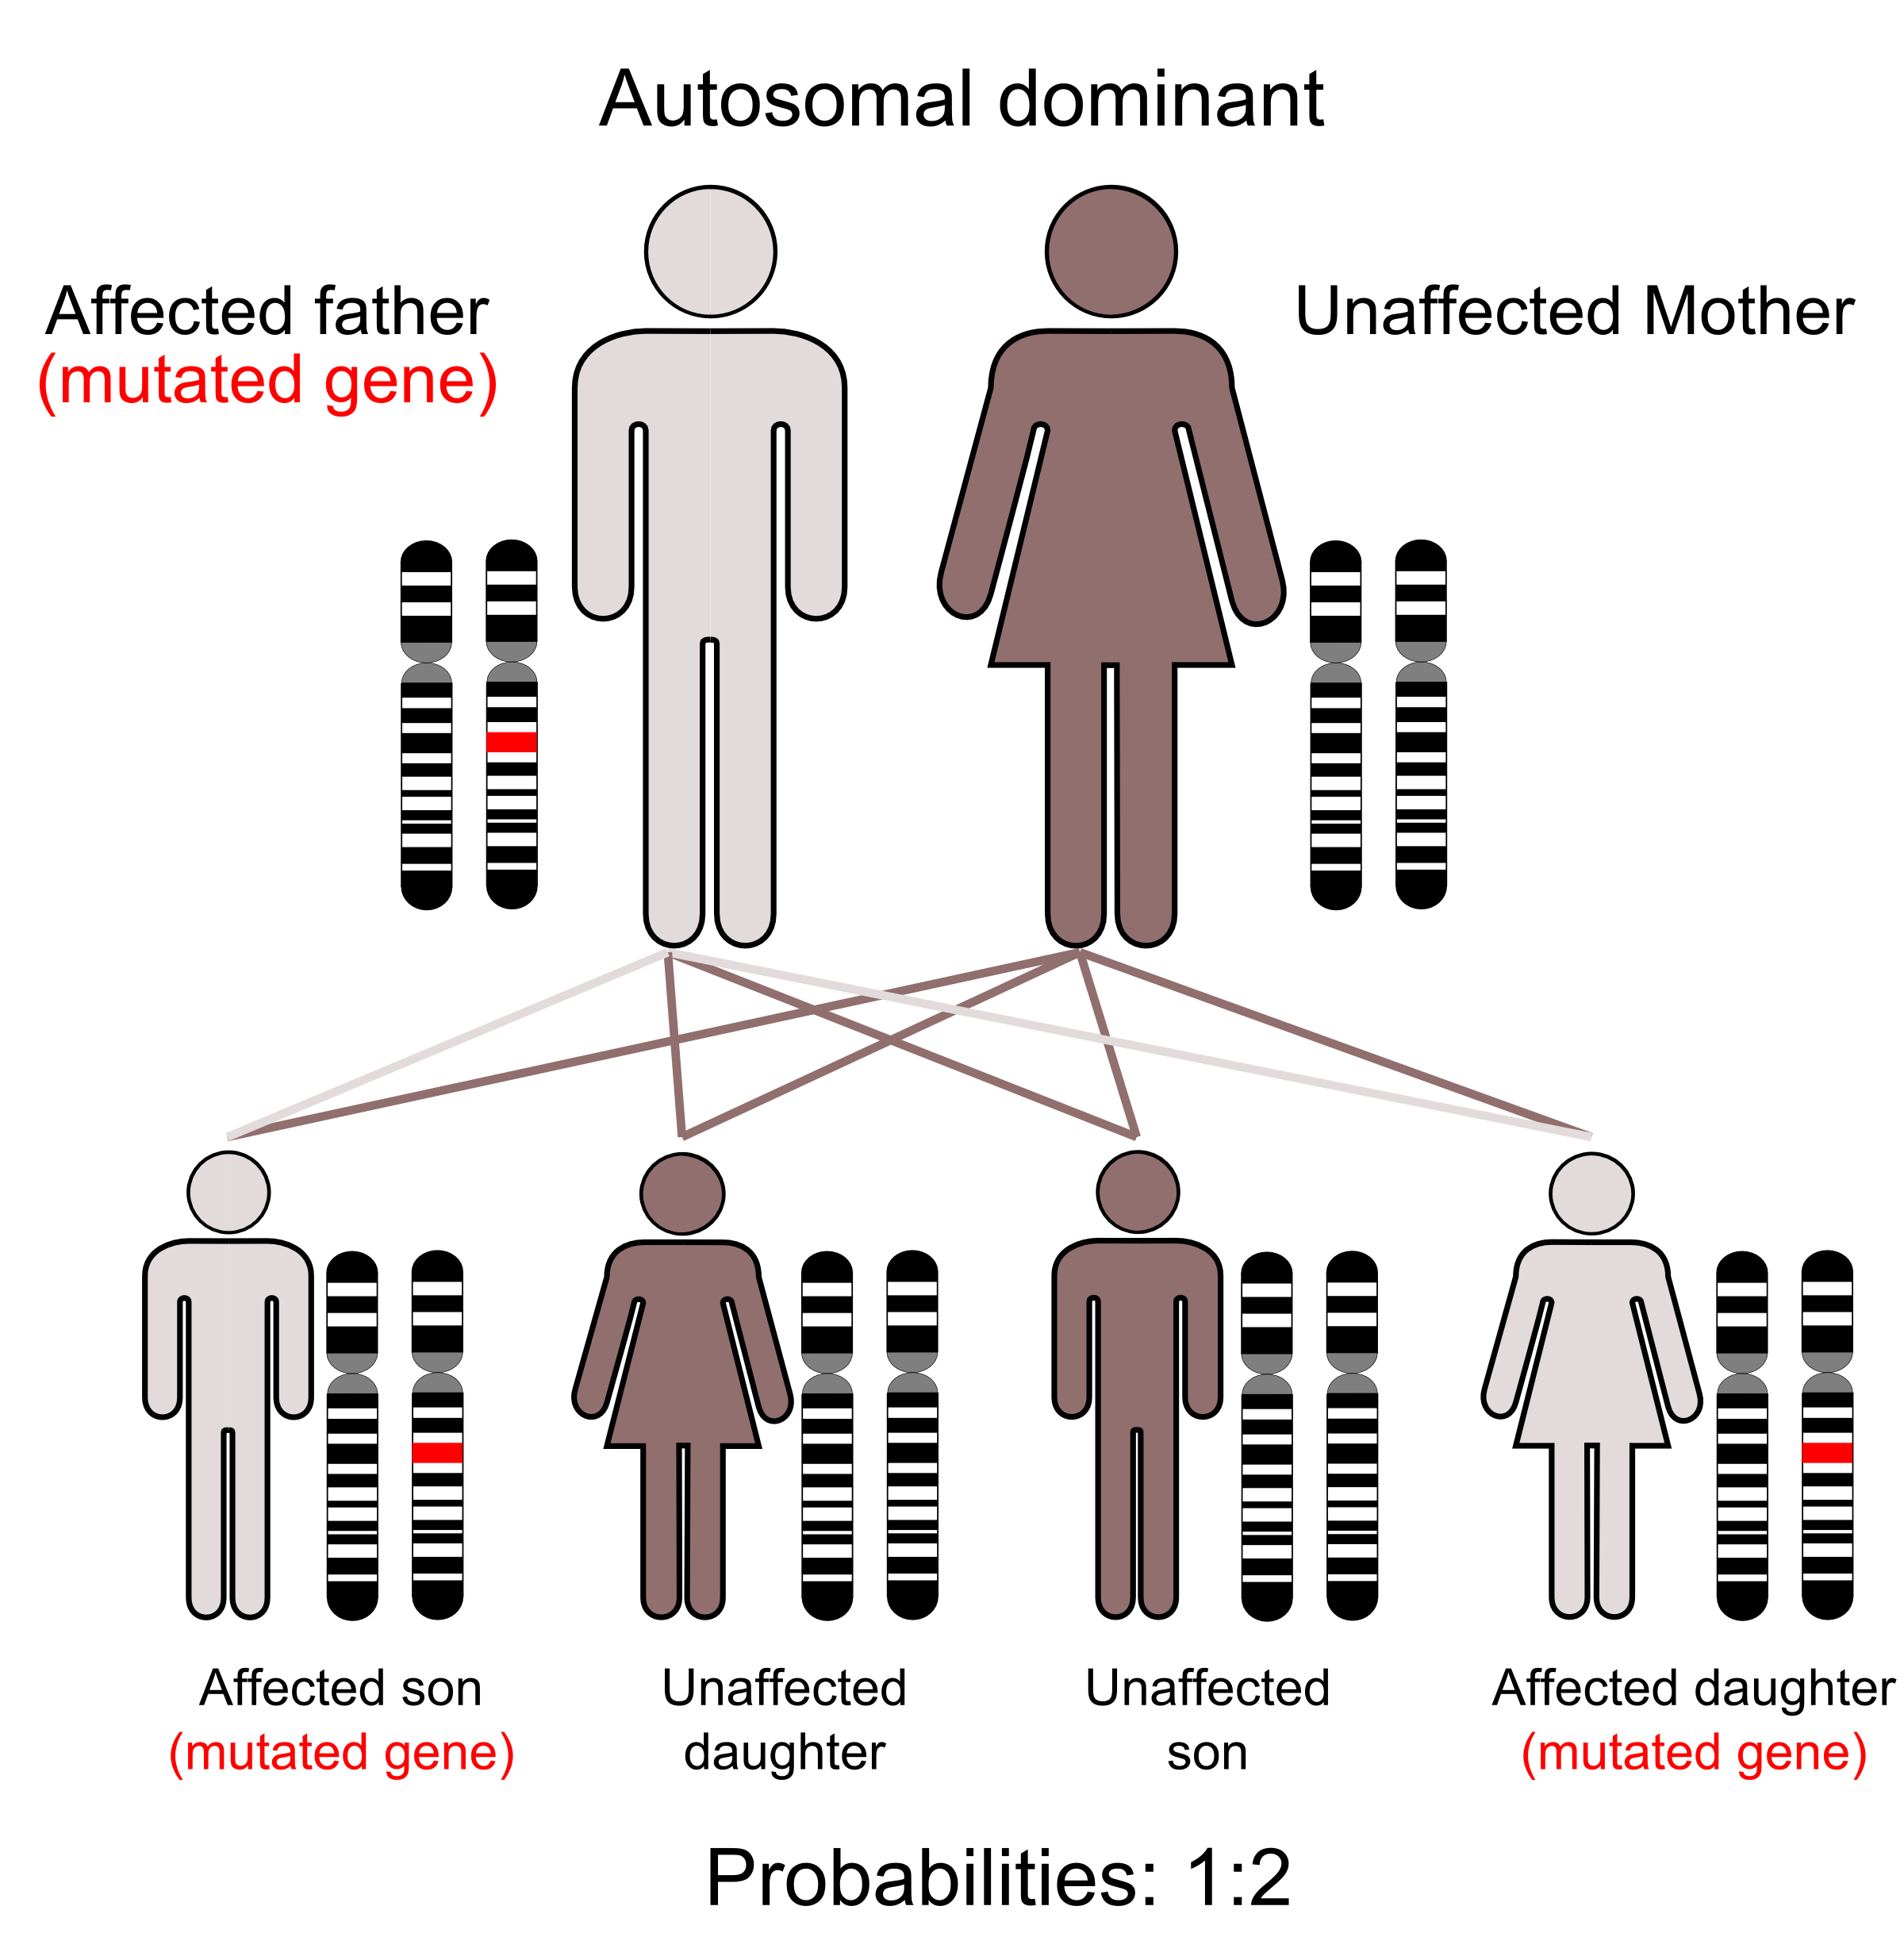
Many traits which run in human families do not exhibit a simple pattern of Mendelian inheritance. This is usually because these traits are coded for by more than one gene. Conversely, traits that are governed by one gene are typically an abnormality that is life-threatening or debilitating (e.g., Huntington’s Disease, caused by a dominant allele, and Cystic Fibrosis, caused by a recessive allele)]. From a methodical analysis of pedigree charts, we can determine if a particular trait is encoded for by different alleles of a particular (single) gene, as well as if the single-trait gene is recessive or dominant. We may also be able to determine if a trait is autosomal or sex-linked.
What is a genetic pedigree?
A genetic pedigree chart is a family history diagram that differs from a genogram in that it does not include the psychosocial history that is collected when drawing a genogram and ecomap. A genetic pedigree captures details about the health of multiple generations. This information can be important in diagnosing an inherited condition, revealing a pattern of inheritance, and informing clinical decisions regarding testing and management. Understanding the relationships between family members can also be useful when considering the communication of information and the clinical management of the whole family.
A genetic pedigree is a visual representation of several generations in a patient’s family. It shows how family members are related to each other and notes any medical conditions they may have along with any other pertinent information. For example, a family’s ethnic background may be relevant, as this could indicate whether certain tests should be considered based on the frequency of conditions in different populations.
The information needed to draw a pedigree is usually collected through a series of questions about each member of the family. Standardized symbols and lines are used to represent the family members and their relationships.
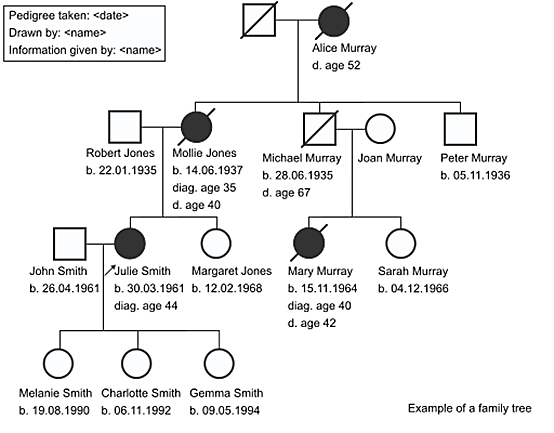
The example here shows a four-generation pedigree. The person giving the information is Julie Smith, as noted by the small arrow. Julie, her mother Mollie, her grandmother Alice, and her cousin Mary, have all been affected the same medical condition, indicated by the shaded circles.
The symbols and lines
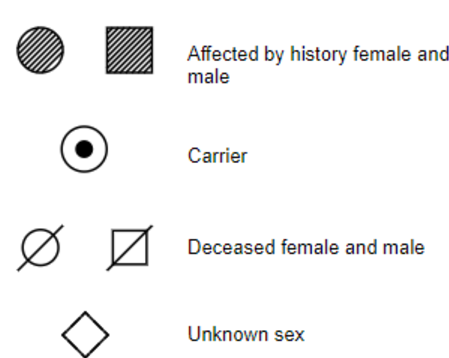
So that any health professional can read and understand a genetic pedigree, they use a set of internationally recognized symbols and lines, based on the proposed system by the National Society of Genetic Counselors.
These diagrams are used to determine the mode of inheritance of a particular disease or trait, and to predict the probability of its appearance among offspring. Each pedigree chart represents all the available information about the inheritance of a single trait (most often a disease) within a family. The pedigree chart is therefore drawn using phenotypic information, but there is always some possibility of errors in this information, especially when relying on family members’ recollections or even clinical diagnoses. In real pedigrees, further complications can arise due to incomplete penetrance (including age of onset) and variable expressivity of disease alleles, but for the examples presented in this book, we will presume complete accuracy of the pedigrees — that is, the phenotype accurately reflects the genotype. A pedigree may be drawn when trying to determine the nature of a newly discovered disease, or when an individual with a family history of a disease wants to know the probability of passing the disease on to their children.
Additional symbols
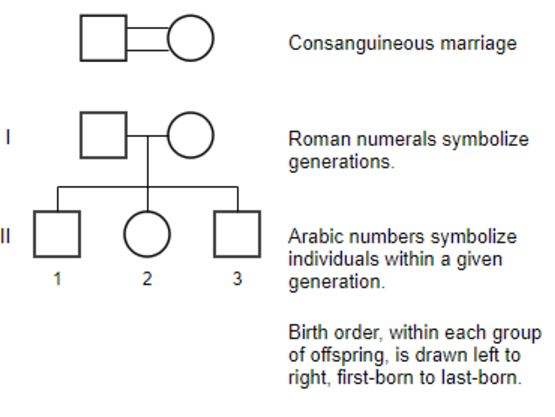
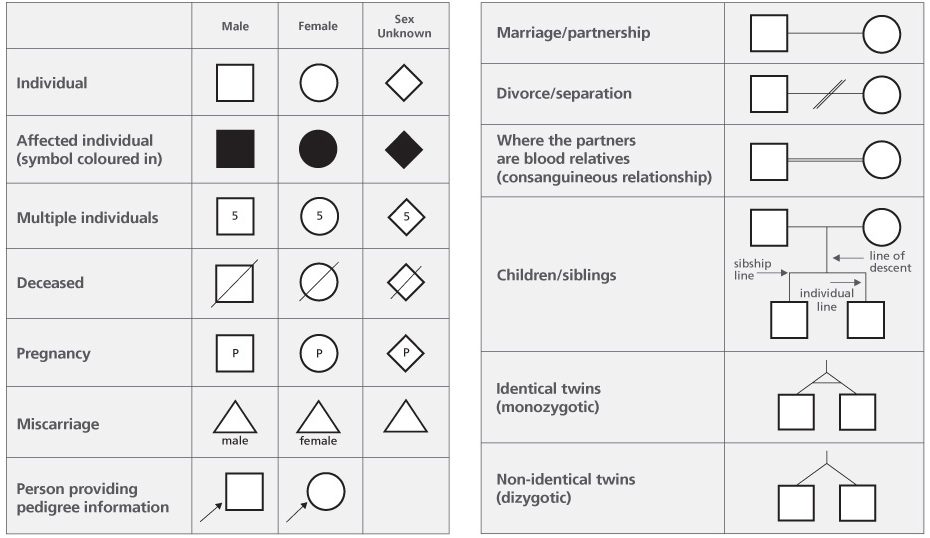
Symbols are used to construct pedigree charts. The major ones are as follows: male – square; female – circle; marriage – square and circle linked by a horizontal line. Males partners are usually to the left of the female partner; an individual affected by the trait has their symbol shaded; carrier – sex symbol with a dot inside; deceased – sex symbol with a diagonal line running through it; unknown sex – a diamond; Roman numerals symbolize generations, and Arabic numbers symbolize individuals within a given generation; birth order within each group of offspring is drawn left to right, from first-born to last-born.
A note on how sex is depicted in pedigrees
Historically, circles have been used to represent females and squares males in pedigrees. As geneticists gain a better understanding of sex and gender, however, it becomes increasingly apparent that this is not always an accurate representation of either an individual’s sex or gender. There are multiple ways to define “male” and “female”. For example, an individual with chromosomes typically associated with males (XY) can have gonads and/or external anatomy that is typically associated with females. Likewise, an individual with chromosomes typically associated with females can have gonads and/or external anatomy that is typically associated with males. Depending on the purpose of the pedigree, different definitions of male and female may be more useful than others.
In this module, we will use pedigrees to determine mode of inheritance, including whether a gene is carried on the X- or Y- chromosome. Therefore, unless otherwise indicated, we will most often use the symbols to represent chromosomal sex, with circles to represent people with the most common female chromosomal genotype (XX) and squares to represent people with the most common male chromosomal genotype (XY). It should be understood that this is not a complete description of any individual’s sex (sex assigned at birth, sex determined by external genitalia, or gonadal sex may be different may be different from chromosomal sex) or gender (which may be cisgender or transgender).
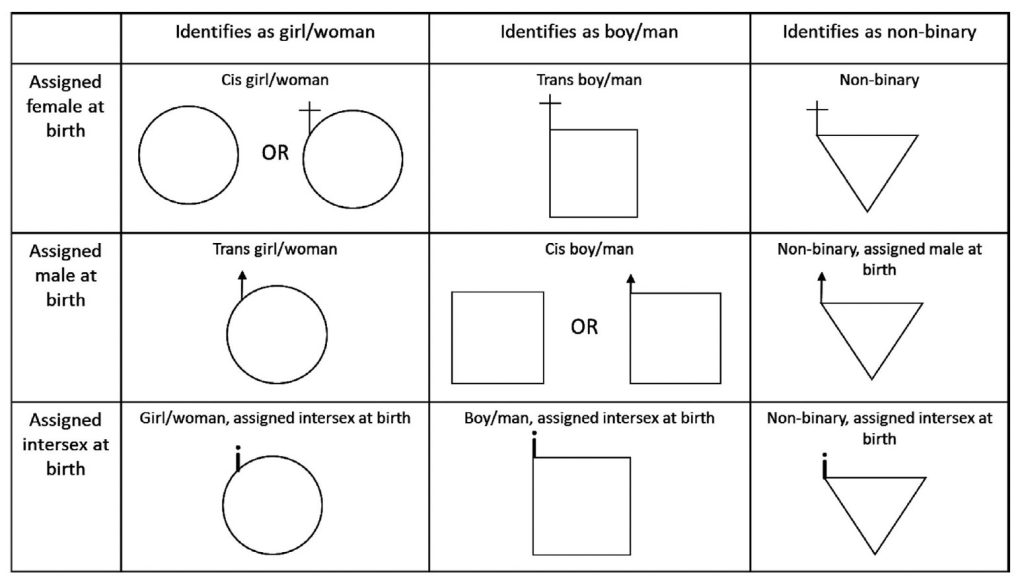
Other symbols may offer a more complete or accurate representation of a person’s sex or gender. While there is not currently a single standard for representation of transgender and gender diverse individuals or individuals with differences of sex development, there are a number of proposals from within the genetic counseling community (Sheehan et al., 2020; Tuite et al., 2020). One example, from Tuite et al (2020), is shown in Table 1.
The affected individual that brings the family to the attention of a geneticist is called the proband (or propositus). If the individual is unaffected, they are called the consultand. If an individual is known to have symptoms of the disease (affected), the symbol is filled in. Sometimes, a half filled-in symbol is used to indicate a known carrier of a disease; this is someone who does not have any symptoms of the disease, but who passed the disease on to subsequent generations because they are a heterozygote. Note, that when a pedigree is constructed, it is often unknown whether a particular individual is a carrier or not, so not all carriers are always explicitly indicated in a pedigree. For simplicity, in this chapter we will assume that the pedigrees presented are accurate, and represent fully penetrant traits.
Other conventions:
- Female carriers of X-linked traits are indicated by a circle with a dot in the centre.
- If possible, the male partner should be left of female partner on relationship line.
- Siblings should be listed from left to right in birth order, oldest to youngest.
Answers to frequently asked questions can be found here. This page also contains a number of high quality video interview of a healthcare provider taking a family history and drawing a pedigree chart. These are excellent for further review or practice.
Attribution & References
Except where otherwise noted, this content is adapted from:
- Taking and drawing a family history: Constructing a Pedigree Chart by Genomics Education Programme, CC BY-NC 4.0
- 4.1 Introduction In Introduction to Genetics by Natasha Ramroop Singh, Thompson Rivers University, CC BY-NC SA 4.0
- 4.2 Symbols used in Pedigree Charts In Introduction to Genetics by Natasha Ramroop Singh, Thompson Rivers University, CC BY-NC SA 4.0
- Pedigree analysis In Chromosomes, Genes, and Traits: An Introduction to Genetics by Amanda Simons, Framingham State University, CC BY-NC SA 4.0
References
Mayo Clinic Staff. (n.d.). Cystic Fibrosis. MayoClinic.org. Retrieved January 18, 2022 from https://www.mayoclinic.org/diseases-conditions/cystic-fibrosis/symptoms-causes/syc-20353700
Mayo Clinic Staff. (n.d.). Huntington’s disease. MayoClinic.org. Retrieved January 18, 2022 from https://www.mayoclinic.org/diseases-conditions/huntingtons-disease/symptoms-causes/syc-20356117
Sheehan, E., Bennett, R. L., Harris, M., & Chan-Smutko, G. (2020). Assessing transgender and gender non-conforming pedigree nomenclature in current genetic counselors’ practice: The case for geometric inclusivity. Journal of genetic counseling, 29(6), 1114–1125. https://doi.org/10.1002/jgc4.1256
Tuite, A., Dalla Piazza, M., Brandi, K., & Pletcher, B. A. (2020). Beyond circles and squares: A commentary on updating pedigree nomenclature to better represent patient diversity. Journal of genetic counseling, 29(3), 435–439. https://doi.org/10.1002/jgc4.1234

