5.8 Evaluation and Documentation of Processes
The evaluation and documentation of business processes are essential for understanding, optimizing, and managing organizational workflows. These practices provide a structured approach to visualizing how work is performed, identifying inefficiencies, and implementing improvements that enhance performance, reduce errors, and optimize resource utilization.
The Importance of Process Documentation
Effective process documentation serves several strategic and operational purposes. Key benefits include:
Standardization
Ensures consistency in task execution across departments and teams, reducing variability and enhancing quality.
Training and Onboarding
Acts as a reference guide for new employees and supports cross-training initiatives, accelerating learning and reducing dependency on informal knowledge transfer.
Regulatory Compliance
Helps organizations meet external regulatory requirements and internal quality standards by providing clear, auditable records of how processes are executed.
Continuous Improvement
Facilitates the identification of bottlenecks, redundancies, and inefficiencies, enabling data-driven process enhancements.
Knowledge Retention
Captures institutional knowledge, preserving critical information and reducing reliance on specific individuals or informal practices.
Common Tools for Process Documentation
To effectively document and evaluate processes, organizations use a variety of tools. Two of the most widely adopted are:
- Process Flow Diagrams: Visual representations that map out the sequence of activities, decisions, and flows within a process. They help stakeholders quickly understand how a process operates from start to finish.
- Process Charts: Tabular or graphical tools that detail the steps in a process, including the type of activity (e.g., operation, inspection, transport), the resources involved, and the time or cost associated with each step.
These tools will be explored in greater detail in the following sections, providing practical guidance on how to apply them in real-world business contexts.
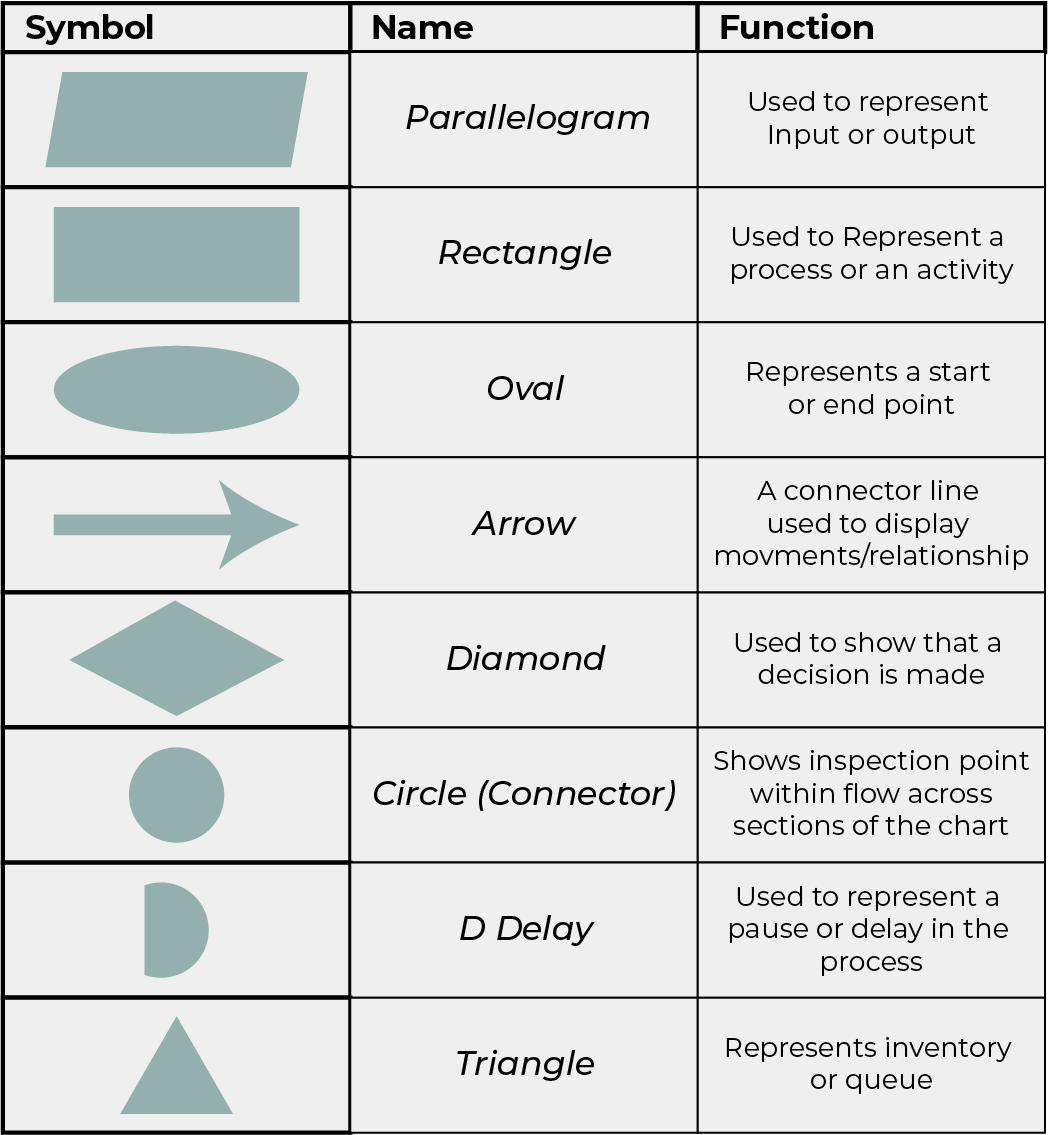
Image Description
A table showing common flowchart symbols, their names, and their functions. It has three columns labelled “Symbol,” “Name,” and “Function.” The rows are as follows:
- Parallelogram – Used to represent input or output.
- Rectangle – Used to represent a process or an activity.
- Oval – Represents a start or end point.
- Arrow – A connector line used to display movements/relationships.
- Diamond – Used to show that a decision is made.
- Circle (Connector) – Shows inspection point within the flow across sections of the chart.
- D Delay – Used to represent a pause or delay in the process.
- Triangle – Represents inventory or queue.
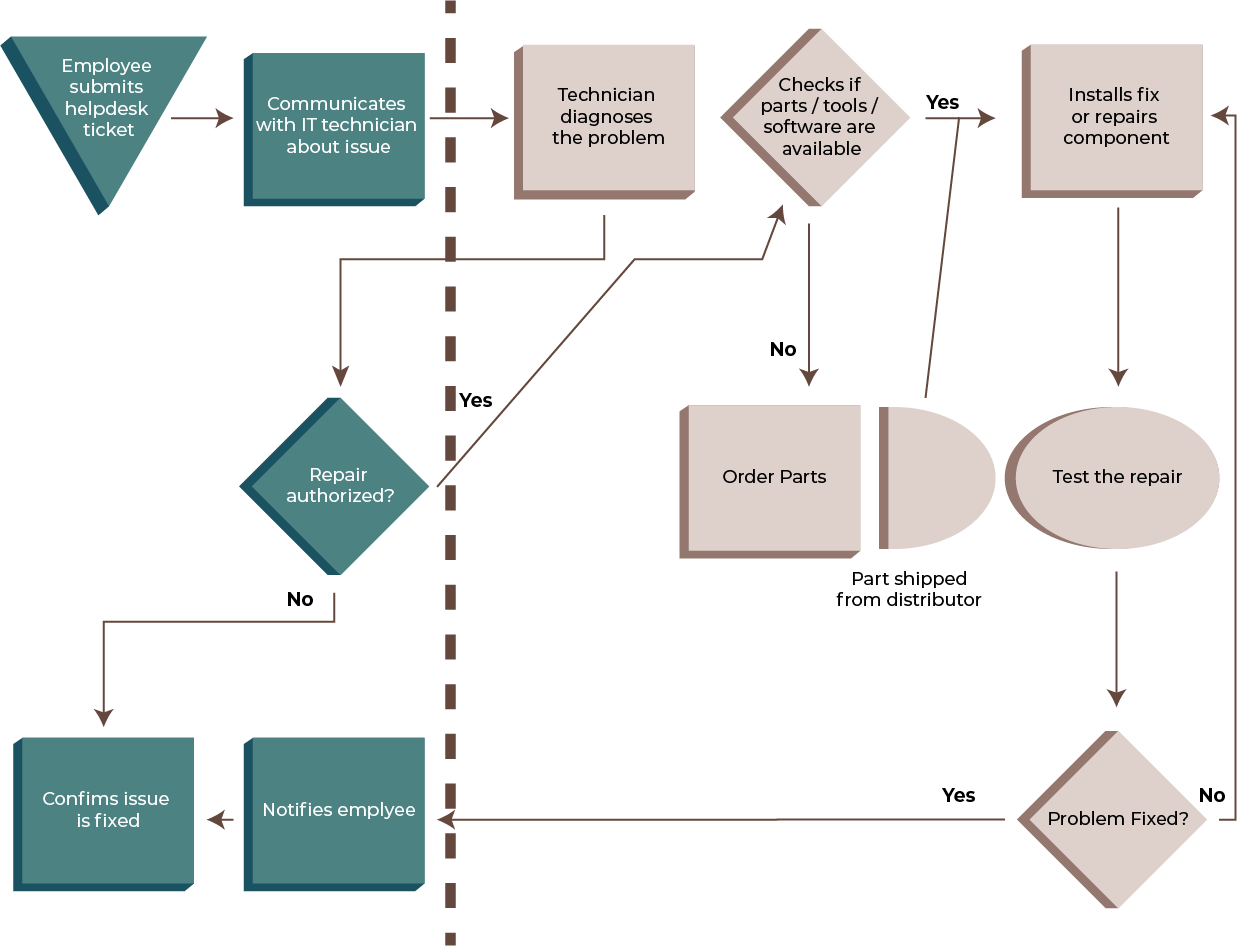
Image Description
A flowchart illustrating the IT helpdesk ticket process. It is divided into two sections by a dashed vertical line. The left section represents the employee and initial communication; the right section represents technician actions and repair processes.
Left section (Employee/Communication):
- Triangle: “Employee submits helpdesk ticket”
- Rectangle: “Communicates with IT technician about issue”
- Diamond: “Repair authorized?”
- If No → “Notifies employee” → “Confirms issue is fixed”
- If Yes → Flows to technician side
Right section (Technician):
- Rectangle: “Technician diagnoses the problem”
- Diamond: “Checks if parts/tools/software are available”
- If Yes → “Installs fix or repairs component”
- If No → “Order Parts” → Half-circle: “Part shipped from distributor”
- Oval: “Test the repair”
- Diamond: “Problem fixed?”
- If Yes → Return to employee side: “Notifies employee” → “Confirms issue is fixed”
- If No → Loops back to diagnosis or additional repair steps
The chart uses standard flowchart shapes and directional arrows to indicate decision paths and sequences. Color coding distinguishes employee-related steps (teal) from technician-related steps (brown).
A process flow diagram can go beyond representing the production process by showing all the activities that are carried out in an organization. These diagrams are known as Swim Lane flows, as shown in Figure 5.6.3, depicting the process of order filling.
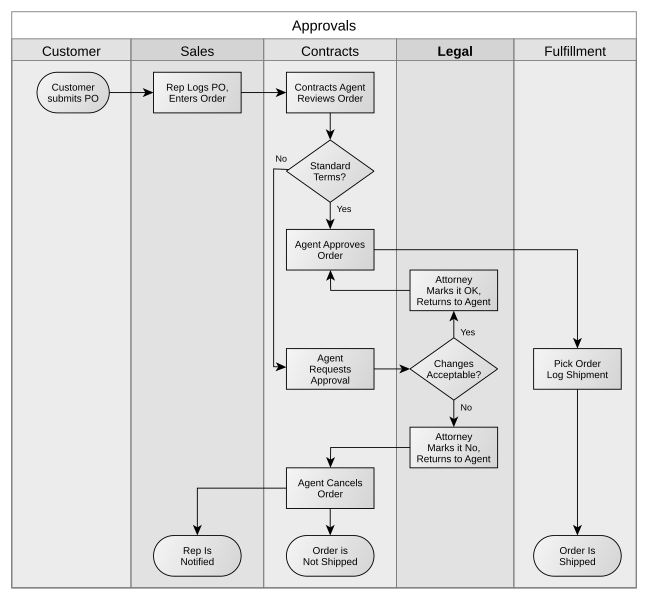
Image Description
A swimlane flowchart titled “Approvals” depicts the order approval process across five departments: Customer, Sales, Contracts, Legal, and Fulfillment.
- In the Customer lane: A process starts with “Customer submits PO” (purchase order).
- In the Sales lane: “Rep Logs PO, Enters Order.”
- In the Contracts lane:
- “Contracts Agent Reviews Order”
- Decision: “Standard Terms?”
- If Yes → “Agent Approves Order” → Moves to Fulfillment.
- If No → “Agent Requests Approval”
- If denied → “Agent Cancels Order” → “Rep is Notified” (Sales) → “Order is Not Shipped”
- If legal review is needed, it moves to the Legal lane.
- In the Legal lane:
- “Attorney Marks it OK, Returns to Agent”
- Or decision: “Changes Acceptable?”
- If Yes → “Attorney Marks it OK, Returns to Agent”
- If No → “Attorney Marks it No, Returns to Agent”
- If approved by Legal and Contracts, it goes to the Fulfillment lane:
- “Pick Order, Log Shipment” → “Order is Shipped.”
The flowchart uses standard symbols: ovals for start/end, rectangles for processes, and diamonds for decisions. Each lane represents a department, and the flow of tasks is shown using arrows.
OpenAI. (2025). ChatGPT. [Large language model]. https://chat.openai.com/chat
