2 Chapter 2: Methodology you need
The Essential Neuroscience of Human Consciousness
The Essential Neuroscience of Human Consciousness
Amedeo D’Angiulli
Chapter 2: Methodology you need
2.0. The history of consciousness
2.1. Historical note on the neuroscience of consciousness
2.2. Understanding what “functional” means
2.3.1. Neuropsychological approach
2.3.2. Neurological examination
2.3.3. Experimental methods
2.4. Elements of Functional neuroimaging
2.4.1. Hemodynamic-based imaging techniques: fMRI and PET
2.4.2. Electrodynamic-based imaging techniques: EEGs and ERPs
2.4.3. Brain stimulation techniques: TDCs and TMS
Chapter 2: Methodology you need
2.0. The history of consciousness itself
To understand the origins of consciousness itself, one must also go back to the origins of an extremely important biological group: vertebrates. Around 500 million years ago, back in the Cambrian Period (250 million years before the first dinosaurs came to be), the first organisms with a vertebral column and skull began to appear. Vertebrates had two important advantages over other organisms: isomorphic maps and mental images. Isomorphic maps are neural representations of the world organized spatially according to different points in the sensory field. These include spatially-oriented ones, such as retinotopic, somatotopic and nociceptive maps, as well as non-spatially organized, chemotopically-mapped representations of olfaction and gustation. Do note that isomorphism derives from genetically programmed neural crest and placodes.
Mental images are tightly linked to sensory consciousness: They are the aspects of phenomenal consciousness that are direct and immediate results of the brain’s processing of sensory information. Primary consciousness is ”The state of being mentally aware of things in the world, of having mental images in the present” according to Edelman, 1992.
There is some debate around what the first conscious sense was. Feiberg & Mallatt (2016) propose that it was vision, though other views on the topic also include olfaction (Schneider 2014) and nociception (Kunzendorf 2015). Others raise the question of a possible role for motor planning and execution.
The minimum requirement for sensory consciousness and qualia is a brain including a hindbrain, midbrain and forebrain but not necessarily a developed cerebral cortex/pallium. It also needs to have two specific functions:
- Hierarchical systems of intercommunicating, isomorphically organized, processing nuclei that integrate the senses into representations that emerge in upper levels of the neural hierarchy
- Widespread reticular formation that integrates the sensory inputs and contributes to attention, awareness and neural synchronization.
Evolution might have been guided along a two-step process: Originally, the optic tectum was the center of multi-sensory conscious perception, notably in fish and amphibians. Then, there was a gradual shift to the dorsal pallium or cerebral cortex in mammals, reptiles and birds.
An embodied organism (ex: worm) reflexively interacts with the environment to carry out its goal-directed survival processes. The subsequent addition of elaborate, non-reflexive neural hierarchies leads to complex and context-dependent behaviours. This is because:
- The brain’s new, mapped images of the environment guide behavioural actions to the right location.
- The newly evolved affective feelings motivate and direct behaviours toward ‘‘positive” and away from ‘‘negative” stimuli.
This transition opens a seeming ‘‘gap” between subjective experience and drive, on one hand, and the objective world affected by the behaviours, on the other. However, nothing is philosophically ‘‘mysterious” about this when viewed within the evolutionary context and its general biological/neurobiological features.
To put it simply, subjective consciousness has evolved for survival. The general feature of adaptation is paramount for explaining qualia because qualia act to distinguish among many sensory stimuli, as needed for survival. The first, simple qualia evolved into millions of subtly differentiated qualia. Increasingly refined sensory discrimination provided survival benefits for identifying food, mates, dangers, etc which apply in many different situations. These advantages allowed conscious organisms to prevail more often than not, and thus led to their successful spread.
The brain never refers experience to the neural substrate of the brain that creates it. Neurons have operated efficiently like this since the preconscious, reflexive stage. Besides being redundant, any conscious attention to neuronal maintenance would distract from the other important purposes of consciousness. Inefficiency and waste of effort are selected against, so no ”objective” experiencing of the brain’s own neuronal signals ever evolved. However, is this an explanatory gap or an explanatory solution? The gap between subjective/auto/1st-person consciousness and objective/allo/3rd person is a solution, not a problem, devised by evolution.
2.1. Historical note on the neuroscience of consciousness
The most important milestones in the history of the neuroscience of consciousness are perhaps best framed around the concept of localization of functions. This refers to the materialist assumption that brain functions are in physical bits of neural tissue. If one focuses on modern science and ignores the Greek thinkers, that story begins with Francis Gall’s phrenology. This was the idea that each complex psychological function, such as intelligence, memory and the like, was mapped onto specific brain areas. Their sizes determined the strength or weakness of the function, influencing an individual’s skull shape. Thus, by measuring it, one could predict individual differences in brain functions. However, neither these one-to-one function-scalp maps or entire skull shapes ever produced a shred of real evidence.
The definitive debunking of phrenology came with Pierre Flourens’ experimental ablation studies. He removed certain parts of animal brains and observed the surgery’s effects on behaviour; control of the disrupted behaviour was then attributed to the removed area. However, while there were some links between ablation of subcortical regions and simple functions, Flourens did not find clear correspondences between behavioural functions and cortical ablations, no matter what was removed. He then concluded that complex functions were distributed in the cortex and not compartmentalized. By then, it was clear that neuroscience of functions was caught at an impasse between “narrow localization” (few millimetres or centimetres of brain tissue) and “massive distribution” (many centimetres across the brain’s surface).
Prior to and while animal ablations were being explored, a considerable amount of observations was being accumulated by clinicians dealing with brain lesions. In particular, it had long been known that a lesion to either side of the motor cortex was associated with complete paralysis of the opposite side’s (contralateral) limbs. A lesion of the post-central cortical region (posterior to the central sulcus) was associated with loss of sensation on contralateral sides of the body, and a lesion to the occipital region to blindness. However, the birth of neuropsychology (the discipline studying the role of brain systems in complex mental activity) can be rightly set in 1861. That is when Paul Broca, autopsying a stroke patient, discovered that destruction of the posterior third of the left inferior frontal gyrus (a region still called Broca’s area) was associated with aphasia. That disorder is a severe disturbance of motor, expressive speech without other deficits. Broca concluded that this cortical region was the center for the “motor images of words” (Luria, 1973; p. 20). A decade after, Karl Wernicke reported another case study of an autopsy, except this time the focal lesion involved the posterior third of the left superior temporal gyrus (still known as Wernicke’s area). It was associated with a deficit in speech and language comprehension but intact expressive speech. That region, he concluded, was the center for “sensory images of words” (Luria, 1973; p. 22).
By then, the evidence seemed to favour narrow localization. However, another debate was occurring simultaneously concerning the discovery of cellular structures. About fifty years earlier, an experiment by Luigi Galvani and the first electrical stimulation experiments by Fritsch and Hitzig showed that electrical impulses were used in the brain as way to communicate between neural structures. This was deducedsince electrically stimulating parts of the primary motor cortex produced movement. Thus, more evidence supported the localizationist view. Golgi discovered the stain technique for imaging neural tissue. His anatomical studies, however, were thought to show a continuous functional unit between nerves and brain (integralism/noeticism). That occurred until Ramon Y Cajal claimed his and Golgi’s stain data showed a network of discrete units, neurons, separated by gaps. The battle raged on until 1930 when the gap – the synapse – was finally identified by Sherrington. As a result of this intense research competition, scientists began to carefully classify the different subtypes of neural tissue. Cortical regions were classified on the basis of cell structure and arrangement (cytoarchitecture). Working the localizationist assumption that anatomical boundaries would reflect functional divisions for the complex mental activities areas were used for, Brodmann used cellular organization to map and divide the cerebral cortex into 52 distinct areas. Many others attempted to map the cortex and come up with different numbered areas, but Brodmann’s numbers are still somewhat in use today.
Aside of the practical use to differentiate cellular organization, complex functions remained a controversial focus of research. For the most part, the debate was reignited by Karl Lashley. He systematically removed sections of the cortex in rats and tested their ability to learn various mazes. No matter where the lesion was, it did not correlate with a specific deficit; all he found was that the larger the lesion, the poorer the performance (irrespective of location). This is the principle of mass action: all regions of the cortex are equally potentially likely to take on any function (principle of equipotentiality).
In summary, neuropsychology has historically been developed as the study of the functional organization of the brain, this organ of complex mental activity related to consciousness. It participated in the broader neuroscience debate between two traditional factions, localizationism (“functions are mapped in specific areas of the brain/cortex”) vs. integralism/noeticism (“brain is an undifferentiated mass, functions are generated by mass action). A resolution of the debate was proposed by Aleksandr R Luria, who used the idea of levels of organization originally introduced by Hughlings Jackson. Luria reformulated much of modern neuroscience and advanced the field to its current place. Although some of his details are dated, Luria’s explanation is still the best account of complex mental activity in terms of systems dynamic brain functions.
2.2. Understanding what “functional” means
The localizationism vs. mass action debate raises some crucial questions, especially in the context of functional neuroimaging. Problems associated with narrow localizationism concern changes in the psychological process when there are lesions in individual areas, which do not lead to loss of a function. To begin with, there are substantial structural individual differences in the way the brain implements functions. My visual cortex is probably different (ever so slightly) from yours. Brain areas with lesions undergo reorganization so that the same function can be done or reused in different ways. Even if lesions are so narrow as to just affect one group of cells, there are lots of individual variation in cellular morphology so that the same lesion could cause different symptoms. The loss of simple functions, such as the senses, is associated with destruction of a particular brain area. However, this is not the case with higher mental processes. Complex functional systems can be affected by an impairment of any of their components, and the same brain area can be used for different functions (neural reuse). Therefore, loss of function does not tell us anything about its localization for complex functions.
Starting from the issues with narrow localizationism, Luria offers the following definitions:
Simple function: Function of a particular tissue. Ex: Light > Retina > Neurons in V1
Complex function: Functions as functional systems. Ex: Function of digestion, respiration, etc
General definition of function: Constant, invariant task performed by variable mechanisms leading to a constant, invariant result.
Luria’s analysis implies that elementary functions of a tissue can be mapped to precise localizations in the brain, while complex functional systems cannot. This is especially applicable to higher forms of mental activity which are organized in systems of brain zones working in concert, each performing its role.
An example of complex function concerns actions. Be careful – we are talking about actions, not behaviours. A behaviour is a specific organized motor output, such as grabbing a cup with the fingers of your hand. An action includes motor outputs and goals, such as grabbing the cup but using your feet or mouth; it can be performed using different behaviours. Some of its properties include:
a) Dynamic interchangeability of components or the system subcomponent that supports the function. In our example, hand, feet and mouth can be used interchangeably to achieve the same goal: grabbing a cup. There are many ways in which the same function can be implemented to reach a goal.
b) The system cannot be considered made of isolated, indivisible “faculties”. A partially damaged brain does not operate like a normal brain minus one part. The brain is dynamic, and damage to one structure can cause trauma in other structures and in their connections. Therefore, deficits may be due not just to the missing part but also to the damaged connections.
c) The system is formed during the individual’s history (ontogenetic development). Therefore, it makes provisions for redundancy and plasticity. This means there is overgrowth (followed by specialization, thanks to pruning of neural connections) but also compensatory mechanisms, whereby loss of a function’s subcomponent can be replaced by another subcomponent, showing no deficit as result of impairment
2.3. Observational & behavioural measures
The definition of complex mental functions is conceptually linked with the methodology we use to study consciousness. It is clear by now that a primary aspect of consciousness is purpose, or goal-directed actions and behaviours. Because we can objectify these aspects, we will discuss methodological aspects of consciousness by focusing on what we can observe and measure in individual behaviours.
2.3.1. Neuropsychological approach
Following Luria, the neuropsychological approach to consciousness can be reformulated in greater detail as the identification of: which groups of brain work zones are responsible for complex mental activity; the role of single zone components within the complex functional system; and how the relationships between these zones change during an individual’s developmental periods. In other words, the tasks of neuropsychology are:
- The detailed qualification of symptoms (i.e., observable impairment)
- The analysis of structures composing functions (i.e., the parts that go into an observable response and action that is directed to some goal)
- The inference of underlying organization of the system (i.e., parts within the whole brain system that are recruited and are organized (ordered in a sequence or simultaneously to produce a given function).
The tasks of neuropsychology are approached by using syndrome analysis. This approach focuses on comparing symptoms associated with a focused lesion, as well as disturbance of that same function by differently located lesions.
The main methodological tool used is double dissociation. In neuropsychology, a single dissociation is when a change affecting the activity of a relatively focused brain area X impacts a function A but leaves intact a function B, which is supposedly associated with activity in a distinct brain area Y. This shows that functions A and B are at least partially independent and mapped onto brain areas that do not overlap substantially. The reason one can suspect the activities of distinct brain areas associated with distinct functions to be somehow correlated derives from the mass action principle. It seems safe to assume that virtually any region could be potentially interconnected with another in the intricate web of the brain. A double dissociation is when there exists, at the same time, an effect that shows a reverse effect, e.g. leaves B intact whilst impacting A. Double dissociation could consist of a change in A given B is intact, and another change in B given A is intact. The functions would still be partially dependent, however, and not localized in completely different brain areas. So, single dissociation proves that functions for A and B are not identical. A double dissociation proves (in addition to the fact that A and B are not identical) that one is not a subset of the other. To expand on something we are already familiar with, a lesion in Broca’s area is likely to produce impairment in fluent speech production, whilst likely keeping Wernicke’s area and speech comprehension intact, vice versa.
2.3.2. Functions and Neuroanatomy
Following the method of syndrome analysis and double dissociation, Luria (1973) provided a classification of functional neuroanatomy that is not only still a valid reference model today, but also the point of departure for all work related to consciousness. He divided the brain based on the three most general functions that it operates:
- Regulating tone or waking;
- Obtaining, processing and storing information;
- Programming, regulating and verifying mental activity.
One can (roughly) remap Luria’s functional units using more current terminology. Thus, ‘tone and waking’ can be renamed “level of consciousness”, ‘information processing’ can be renamed “environment consciousness” (which includes 1st-order maps) and ‘the control of higher mental activity’ can be renamed “executive consciousness” (which involves 2nd-order maps). Because the main objective here is to try and classify the various parts of the brain in terms of function, one needs to revisit neuroanatomy. Environmental and executive consciousness are parts of what was defined in Chapter 1 as part of core consciousness.
To recap, the central nervous system (CNS) consists of the spinal cord, the brain and the retina. The CNS consists of two major groups of cells, neurons and glia. The neurons conduct short impulses of electricity called action potentials along their membranes and encode data as frequency-modulated signals (different intensities of stimulation are converted into different rates of firing). Glia modify the connections between neurons and can respond to neuron activity by changing voltage across their membranes. They also have many other roles, such as sustaining neurons and providing electrical insulation. Neurons have three main components: the cell body, the dendrites and the axon. Received impulses flow from the dendrites to the cell body followed by the axon. The axon can be over a meter long, and bundles of axons form nerve fibres.
Where an axon reaches the dendrites or cell body of another neuron – in other words, when it synapses with another neuron – it forms a special sort of junction called a synapse. Information transmission across synapses is usually mediated by chemical signals called neurotransmitters, though some synapses use electrical signals instead.
Areas of the brain where there are many cell bodies have a beige/grey tinge and are called grey matter. In the cortex, these areas are set up as layers or sheets. Areas that mostly contain myelinated nerve fibres are called white matter. Masses of grey matter outside of the surface of the cerebral cortex or the cerebellum are called nuclei (“balls”).
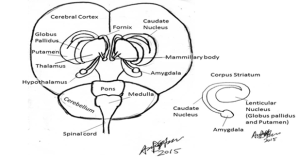
The brain can be divided into five distinct divisions based on embryological development (see Fig 1). These are the myelencephalon, metencephalon, mesencephalon, diencephalon and telencephalon:
Myelencephalon: Medulla oblongata
Metencephalon: Pons and cerebellum
Mesencephalon: Midbrain (tectum containing the superior and inferior colliculus, red nucleus, substantia nigra and cerebellar peduncles)
Diencephalon: Thalamus, epithalamus, hypothalamus and subthalamus
Telencephalon: Corpus striatum, cerebral hemispheres.
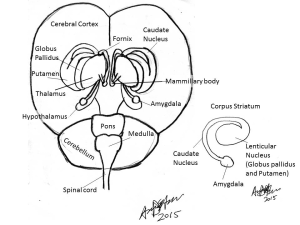
The first general function of the CNS, wakefulness and tonic/background activity, is associated with activity in the reticular formation (RF). This is a group of loosely distributed neurons in the medulla, pons and mesencephalon (see Fig 2), which receives a large amount of autonomic and general input from all sense organs. The intralaminar nuclei of the thalamus are the main destination of reticular output to higher centers. In the most primitive vertebrates, the RF controls most higher functions of the animal. It is also involved in the maintenance of sleep-wake cycles and activates the higher centers. This activity has attracted the label ascending reticular activating system (ARAS) to describe how the activity of higher centers is controlled by reticular input. This label is unfortunate when considering consciousness because it implies that conscious experience is a result of activating the cortex, when it could be due to turning on or off some systems from the RF to the cortex. For example, destruction of the RF leads to coma. Another unfortunate aspect of the current terminology is that the RF not only has an “ascending” pathway but also a descending pathway, which activates lower-level areas of the thalamus and brainstem (descending reticular activating system).
The RF takes its name from a nerve net structure with scattered cell bodies connected by short axons. Excitation spreads over this net not as isolated impulses following the all-or-nothing principle, but by gradually changing the level of excitation (tonic activity) and modulating the entire nervous system’s state. The modulation of the RF occurs by activating and inhibiting nuclei within it. This system’s activity is not tied to specific sensory functions but is associated with specific sources. For the ascending pathway, the most important sources are metabolic processes such as basic vital activity and homeostatic equilibrium, the orienting reflex in response to sensory information, habituation and memory. For the descending pathway, most important sources include top-down regulatory influence of the cortex on the lower structures, regulation of intentional action and emotion, and regulation of general background behaviour.
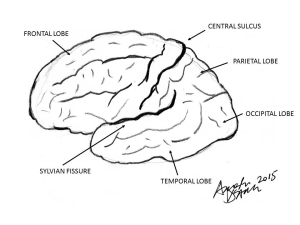
Information from the sense organs travels along the appropriate sensory nerve and once in the brain, is divided into three paths that connect either to the thalamus, the cerebellum or the RF. There are thalamic nuclei for each broad type of sensation, and these have reciprocal connections with specific cortical areas that deal with the appropriate mode of sensation. The large mass of nerve fibres that mediate the connection between the thalamus and cortex are known as the thalamocortical and corticothalamic tracts. The functional unit devoted to processing sensory information is in the lateral regions of the cerebral cortex, known as the neocortex. It has the prefix “neo” (new) since it is thought to be the result of recent evolutionary expansion in primate/mammalian brains. These are the visual (occipital), auditory (temporal) and general sensory (parietal) regions. All these regions are contained between the central sulcus and the Sylvian fissure (Fig 3).
In contrast to the RF, activity in most brain areas is supported by networks of neurons each communicating through phasic activity: all-or-nothing impulses. Technically, all activity of the neural network made by neurons can rarely be described as all-or-nothing, since impulses combine in various non-linear fashions. This means that the final output is almost never the simple summation (linear increase or decrease) of the single all-or-none impulses (whether their polarity sign changes according to excitatory or inhibitory role) . However, general acute responses or neural outputs can, as in other parts of the body, be globally conceptualized as phasic when they are analyzed in relation to behaviors.
The second general function of information processing linked to environmental consciousness mainly exploits two types of neuroanatomical sites. After Luria, these are known as primary sensory areas and secondary associative areas. The primary areas are the most modality-specific regions that can be conceived as distinct; for instance, the occipital, temporal, auditory, somatosensory and tactile cortices. The secondary areas are those between the primary sensory cortices. Stimulation of primary areas produces elementary sensations, like lights or coloured spots for vision. On the other hand, stimulation of secondary areas produces complex scenes, like hallucinations. The roles of secondary areas are two-fold. First, there is the integration of sensory information in a complex synthesis or organization (“gestalts”), which are the sensory modality-specific mental images. Second, there is the conversion of somatotopic maps into functional organization complexes, which form the basis for tactile, motor, and complex mental images of actions.
To better understand how primary and secondary areas work, we need to consider the most important tissue that implements their structural organization, the cortex. It is divided in layers and, according to the type of neurons and processes linking them, activity can be projected in two directions. The first is from a cortical structure to a subcortical or peripheral area (efferent projection), while the second is in the opposite direction, from subcortical/peripheral to cortical (afferent projection). Projections can also be cortical to cortical (associative). Subcortical to subcortical or peripheral to peripheral projections are mostly in arc reflexes. Histologically, the cerebral cortex is a layer of greyish neurons overlying a huge mass of white nerve fibres, the cerebral medulla. It is very deep for humans, containing 100-200 neurons from the surface to the white matter, and is divided into six histological and functional layers. The upper layers (I-III) receive afferent input from relays in the thalamus (ex: lateral geniculate), the thalamus itself, and from secondary projections of other cortical areas. The lower layers give rise to afferent fibres that largely connect with the thalamus and secondary projections to other cortical areas, though specialized processors in the cortex may have direct connections elsewhere, like to motor nuclei. Primary projection areas of the cortex mostly consist of neurons of the afferent layers IV-VI or detectors of specific sensory features. In secondary layers II and III, the associative neurons are less modality-specific and combine features in more complex patterns and functions.
The cerebral cortex has a highly convoluted surface that provides a large area of tissue. The parts of the cortex used for sensorimotor functions are organised so that different areas correspond to different zones of the body. The classic representation of this topological organization is shown by a drawing of the sensorimotor homunculus, which you can find in nearly every psychology or neuroscience textbook. There are also further subdivisions within a given cortical area (turtles all the way down…). For example, the occipital cortex corresponds to the eyes of the sensorimotor homunculus and is further organised so that retinal areas have corresponding cortical areas. This mapping of the retina onto the cortex is known as topological mapping. It results in a corresponding plan of the eye’s receptive field onto the cortex. The mapping is like an image on the surface of the brain, where the scene presented to a subject can be recovered by using fMRI and computer analysis.
Motor control of the body, so important it is for the planning and execution of actions, is accomplished via three main routes. The motor cortex of the frontal lobes and related cortex in the parietal lobes can control movement directly via nerves known as the corticospinal or pyramidal tract. Motor cortex activity is modified and controlled by a loop that passes through the corpus striatum, the substantia nigra and the subthalamic nucleus before returning to the cortex. These controlling nuclei are, along with the amygdala, known as the basal ganglia. The cerebellum and the corpus striatum provide complex reflex control for the body through nerves that travel the red nucleus and form the rubrospinal tract. The vestibular nucleus, which handles signals related to balance and posture, has direct connections with the periphery via the vestibulospinal tract. It is quite neat that premotor and motor areas are anterior to the central sulcus and above the Sylvian fissure; this substantial chunk of cortex is called the frontal lobe.
Histologically, the most notable aspect of frontal lobe areas is that they are (mainly) tertiary: they are made of 70% multimodal layer II and associative neurons. Circuits formed by these neurons and processes seem to be responsible for integrating/translating multimodal sensory information as more abstract patterns or combinations of first and second-order images. For example, translating sequential patterns of activity into simultaneous or spatial organization, sensory-concrete maps into symbols, schemes and categories of stimuli such as human vs animal faces, types of colours, places such as buildings, words, and objects’ shapes, and various forms of memory. Nowadays, the integrative function of information translation within and between modalities is called supramodality. This process extracts common general features from sensory input, combining them to produce a higher-level domain of modality which works on more abstract information than the senses. Some emotions are made in this way. For example, we associate different instances of auditory and motor patterns that correspond to the word “sad” with unpleasant somatic experiences in the body during both perception and memory. When a general feature that describes all this information is extracted, a supramodal representation of “sadness” is generated, which constitutes part of what the knowledge of sadness is. A similar process goes on when we build representations and knowledge of complex objects, the visual, auditory motor and tactual sensations associated with the use and the appearance of an object are combined in a compact fashion in something more abstract (with less sensory detail) that has the general features of the object.
Functionally, the frontal tertiary networks seem to support conscious activity in:
- Planning actions
- Regulation (execution of plans)
- Verification of the correct execution of actions
The direction of the flow of neural activity is generally organized as follows, whereby FEED-FORWARD means “From relatively posterior to anterior cortical areas”, and BACK-FORWARD means “From relatively anterior to posterior cortical areas”.
Primary frontal = Motor cortex. FEED-FORWARD
Secondary frontal = Premotor cortex. Mostly FEED-FORWARD
Tertiary frontal = Prefrontal cortex. Connected with RF and all other parts of brain and cortex. Bidirectional, BACK-FORWARD and FEED-FORWARD
Prefrontal cortex = “Supra-structure”
In the tertiary areas, we can find mosaics of overlapping topological maps. They could intuitively correspond to 2nd-order maps in our minimalist model of consciousness, though there is no evidence for or against this. It is very interesting to look at the entire integration of structures, maps and functions as shown in the summary brain figure in Box 2. From now on, we can truly talk about “functional” neuroanatomy. This is a great step forward when compared to narrow localizationism.
Last but not least, we talked about tertiary areas mainly in terms of frontal areas. However, there is at least one other well-known crucial zone of tertiary areas: the posteromedial cortex (PMC), which includes the parietal cortex and adjacent areas. As anticipated, consciousness neuroscientists are debating whether the hub of consciousness should be assigned to the networks in the frontal parts of the cortex, the PMC, both, or even a more extensive globally distributed network (default mode networks). Does this debate sound like something we have encountered before?
2.3.3 Neurological examination
The neuropsychological principles we have just mentioned can be applied in neuropathology. In this field associated with medicine, neurology and neuropsychiatry, the neuroanatomical substrate of consciousness is organized according to practical, major operational distinctions. It is also related to behavioural manifestations of symptoms for diagnosis: Levels of Consciousness and Contents of Consciousness.
Levels of consciousness coincide approximately with core consciousness proper: wakefulness, attention, self and environmental awareness. Damage to these systems results in states such as coma, or less severe conditions that are however worse than neuropsychological disorders. Generally, the neurofunctional home of these systems is located in the upper brainstem and connecting zone with the diencephalon.
The contents of consciousness are often defined as the substrate through which levels of consciousness are regulated. This involves generation of and “generator centers” for neural patterns and maps. Simply put, researchers believe that levels of consciousness supply the energy – think of it metaphorically as “cortical fuel” – to the cortex. Historically, this was Luria’s concept of “cortical tone” and is currently called “thickness” of cortical tissues. The cortical tone mainly corresponds to Luria’s primary functional unit. In contrast, the contents of consciousness mostly correspond to secondary and tertiary functional units, having to do with representing or mapping the environment and the self. Thus, the contents of consciousness include a mix of core and extended consciousness: sensorimotor functions (cortical), memory (medial temporal, diencephalon/upper brainstem), emotion & purpose (limbic system). Damage in these systems typically results in complex neuropsychological syndromes like agnosia, aphasia, apraxia, amnesia and disorders such as frontal lobe syndrome.
The neurological examination is the most direct and interactive assessment of levels of consciousness. Despite its simplicity, it is one of the best tools in the field because it reveals what an individual can or cannot do. It is also invaluable in diagnosing and tracking recovery of patients with disorders of consciousness. The neurological examination has added value for us in that its comparative approach to the major states of impaired consciousness gives a neurofunctional anatomical model of levels of normal consciousness.
The complete neurological examination includes the following six subcategories of tests:
1) Mental status 4) Reflexes
2) Cranial nerves 5) Coordination and gait
3) Motor examination 6) Sensory examination
In practice, there are many changes to it due to individual variations, clinical style and patient setting. In particular, the examination needs to adapt to patients with impairments of consciousness, since many of the tests cannot always be performed by the book. Case in point, can you seriously imagine yourself asking a locked-in patient to walk around so you can check their gait? Examinations need to be tailored to patients’ strengths and limitations with the right level of difficulty. If tests are too difficult, residual functions and improvement will be missed. On the other hand, if tests are too easy (e.g., asking an aphasic patient to blink), subtle deficits can be missed. To confirm results, it is desirable to use various tests of the same functions and to replicate them at different times.
A neurological examination of patients with impaired consciousness (as demonstrated here https://www.youtube.com/watch?v=SxgO1Zruu94 and here https://www.youtube.com/watch?v=CylQ-Nwwcho ) typically includes the following tests:
1) Mental Status
Orienting questions (calling by name, year etc.), document responses to questions and stimuli
2) Cranial Nerves (CN)
Pupillary responses (CN II, III)
Vision (CN II)
Extraocular movements (CN III, VI, VIII)
Corneal blink reflex, grimace, facial asymmetry (CN V, VII)
Pharyngeal (gag) and tracheal (cough) reflexes (CN IX, X)
3) Sensorimotor exam
Spontaneous movements
Withdrawal or posturing from painful stimuli
4) Spinal Reflexes & movements
Deep tendon
Plantar
The neurological examination can identify major levels of impaired consciousness which then correspond to levels of brain impairment. These will be validated through converging evidence from other objective diagnostics, such as neuroimaging. In this model, the entire CNS can be described by major vertical subdivisions in a top-down approach, including proper brain centers such as the cortex, diencephalon/upper brainstem, brainstem and the spinal cord. Correspondingly, the examination can help assess functional systems along that hierarchy, starting from purposeful responses to stimuli (cortical level), behavioural arousal & sleep-wake cycle (diencephalon/upper brainstem level), brainstem reflexes (brainstem level) and finally, spinal reflexes (spinal level). Appropriately, there are four major levels of consciousness that can be reliably defined according to the model:
Brain death: When all brain functions are lost, from cortex to brainstem, and only the spinal cord is spared. At this level, the neurological examination reveals no response to any stimuli except spinal reflexes. There is no brainstem function and apnea occurs (inability to breathe unassisted or spontaneously). Brainstem function tests include noxious stimuli, temperature and apnea tests, which will (presumably) fail to elicit a response. However, several spontaneous movements and reflexes are mediated by the spinal cord: the deep tendon reflexes in the extremities; abdominal cutaneous reflexes in response to noxious or tactile stimulation; the Babinski sign/plantar response (flexor and extensor); lower extremity triple flexion; spontaneous finger jerks or toe undulation; and occasionally Lazarus signs (unintentional movements of the large extremities, such as legs). In addition to this, autonomic changes such as blushing, sweating and tachycardia can be observable upon stimulation.
Coma: A disorder where activity in the cortex, midbrain diencephalon and upper brainstem is markedly depressed, typically a 50% decrease in global cerebral metabolism. There is complete unconsciousness but brainstem reflexes are preserved. The neurological examination reveals closed eyes; abnormal eye movements; no reaction to noxious stimuli; no orientation or purpose towards stimuli; slower vestibulo-ocular reflex; jaw jerks, gag, cough and swallowing reflexes; abnormal breathing patterns; purposeless automatisms; flexor and extensor reflex posturing in extremities.
Vegetative state (VS): This is a syndrome in which the cortex is severely depressed, the diencephalon/upper brainstem is variably depressed and the brainstem is intact. The corresponding level of consciousness is similar to coma, in that no meaningful responses to external stimuli are shown with intact brainstem and spinal reflexes. However, in contrast to coma, patients show rudimentary orienting/arousal responses and we can observe signs of recovering sleep-wake cycles. At this level, the neurological examination can show, possibly inconsistently, these characteristics: eye-opening; blinking; sounds (moaning, grunting) but no language; possible crying and smiling. Behaviours may or may not be appropriate to context.
Appropriate examination will also identify the following tell-tale signs of a vegetative state: no visual pursuit, no sustained tracking of a visual target or fixation; no localization of stimuli (i.e., no removal of noxious stimulus); no withdrawal in different directions; no coordinated chewing; no grasping, reaching or withdrawal; but sufficient thermoregulatory and basic homeostatic functions.
Minimally conscious state (MCS): A syndrome of variably impaired cortex and diencephalon/upper brainstem. Patients show severely impaired consciousness, but inconsistent or variable evidence of preserved residual consciousness. The neurological examination reveals that patients in this state can sometimes respond appropriately to stimuli and can use rudimentary communication (yes/no, background emotions, understanding and following instructions). The two important criteria for transitioning to a better prognosis and marking recovery are consistent, repeatable interactive communication (via any conventional form) & use of two objects in two distinct occasions.
Exiting the minimally conscious state implies that the level of consciousness is normal, or nearly. At this point, the neurological examination can still be used to identify more subtle deficits in the interaction between levels and contents (like epilepsy and sleep disorders) or just the contents of consciousness (such as neglect or attentional deficits). Nevertheless, there is a general consensus that more subtle and complex syndromes should be addressed with more objective methodological tools. These can complement and/or replace the neurological examination and have the added advantage of being more appropriate in normal individuals as well.
2.3.4. Experimental methods
The most widely used design in functional neuroimaging derives from Donders’ classic 1868 reaction time (RT) paradigm. He measured the time to press a key when an observer was just asked to detect a light (simple RT). Then, he asked the same participant to press the key in response to a certain colour of light (choice RT). Donders found that choice RT typically requires ~50ms more than simple RT. The essence of the idea is that choice RT differs in terms of an additional mental component that can be subtracted. The logic behind functional neuroimaging often follows a similar subtraction method. Images of brain activity recorded before the task (control state) are compared with images of brain activity during the task (task state). It is assumed that subtracting [task minus control] neural activity measurements show active parts of the brain and the extent of activity during a task. A more or less valid assumption is that to isolate the neural correlate of a cognitive component, the only difference between control and task states equals the component – without anything else. This is unfortunately not easily or even possibly guaranteed, so researchers rely on careful design and analysis in their experiments.
Thus, the methods of functional neuroimaging aim for two distinct and complementary outcomes that match the neuropsychological approach discussed in sections 2.2-2.3. The first methodological strategy is functional segregation: identifying cortical areas specialized for some aspects of sensorimotor or perceptual processing. The second strategy is functional integration: complex functions (and behaviours) involve many areas that interact and combine resources via integration. Though different versions of subtraction, these strategies are still based on a compatible assumption that constituent mental operations can be broken down. To achieve its objectives, functional neuroimaging must separate active components of interest from dormant components in-vivo. How can this be achieved?
2.4. Elements of Functional Neuroimaging
To understand how it is possible to segregate and integrate functions, we first need to understand how images of brain activity in different states are made and obtained. The most common neuroimaging techniques are based on two types of brain activity: hemodynamic (related to blood metabolism) and electrodynamic (related to postsynaptic electric activity).
Before dealing with the pictures, we need to establish some terminology. Task, resting and control states are known in terms of behavioural or task-related time periods during which we observe the subject. However, when we look at pictures of the brain, we need to distinguish between activity (which can be spontaneous, resting and unrelated to task or stimulation) and activation (a task-related change in activity, often an increase).
2.4.1. Hemodynamic-based imaging techniques
2.4.1.1. Positron Emission Tomography
It is common knowledge that anatomical structures can be imaged by passing X-rays through tissue; bones will appear white and surrounding tissues will have tones of grey. Computed axial tomography (CT) also exploits 3D X-rays in making reconstructions, scanning structures in the body then reconstructing them via 3D radiation. An injected radioisotope will emit electrons with a positive charge (positrons) which then combine with nearby electrons and disintegrate. Following this reaction, gamma rays are emitted (reflecting positron annihilation) wherever the substance is traveling in the bloodstream and surrounding tissues. This is very interesting, since we can track down gamma rays by measuring the distribution of radioactivity from the tissues (autoradiography).
Now, if you inject a radioisotope and combine it with a CT, you can reconstruct the isotope’s distribution in structures in vivo and in 3D. You can see where they originate in brain tissues and where they move to within since CT scans provide the underlying structures. The most sophisticated versions of this technique are called Positron emission tomography (PET). PET scanners have rings of detectors around patients’ heads to detect the emitted rays; these signals are then used to build a picture of the distribution and localization of the radioisotope within a plane of the brain.
The most common use for PET is to measure resting regional cerebral metabolic rates for glucose (rCMRGlu). PET can assess regional blood flow (rCBF), oxygen and neurotransmitter/drug uptake. The type of information obtained from PET images depends on the radio compound injected. Common isotopes combine with other elements to create organic molecules that substitute for natural substances, such as water, glucose or drugs. Use of these compounds is picked up by PET, with precision of localization/spatial resolution as fine as 6 mm.
To study rCMRGlu, the most commonly used radioisotope is fluorodeoxyglucose-18 (FDG or 18^F). FDG PET scans give approximately 30 min of glucose metabolism distribution. Given the half-life of FDG (2 hours), these scans are better used to identify resting or control states rather than activation studies. To study rGBF, the most widely used isotope is radiolabeled water-oxygen-15 (hydrogen combined with oxygen 15). This radioactive isotope of oxygen (H2^15O) accumulates rapidly in the brain and typically reflects blood flow for 45s. It is used in many samples of quick pictures and different experimental conditions, such as activation studies, due to its 2-minute half-life and very fast decay of 10 minutes. On average, only about 12 image scans are possible.
Another version of PET, Single photon emission computed tomography (SPECT), is used to detect single photons (low-energy gamma rays). This technology has lower spatial resolution than PET but is longer lasting. It typically uses radioisotopes that have a half-life of 6-13 hours and scans for 20-30 minutes. This technique is especially useful when the process you want to neuroimage occurs in time intervals where one cannot do PET scans, such as epilepsy. SPECT offers the opportunity to inject the radiotracer during or right before the event, then to scan the associated distribution of activated brain regions after the event.
2.4.1.2 Functional Magnetic Resonance Imaging
Functional Magnetic Resonance Imaging (fMRI) detects increases in blood oxygen concentration in areas of increased neuronal activity. When neurons are activated, blood flow increases. The amount of glucose use increases with blood flow (BF) but not with oxygen – small veins draining blood get more oxygen supply which is not used, being instead returned to circulation. In other words, there is a temporary extra supply of unused oxygen. The most common form of MRI is based on BOLD (blood oxygenation level dependent) imaging, which uses the ratio of oxygenated hemoglobin/deoxygenated hemoglobin in active areas. When the ratio > 1, the magnetic resonant signal increases, which is used as marker for activation. Fast scanning (similarly to CT and PET scanning detection techniques) measures BOLD changes and maps them onto a high-resolution scan of the subject’s anatomy.
MRI scanners use huge magnets with field strength greater than 1T, the most recent ones being 8 Tesla strong. There are no known risks; the biggest drawback is that this technique cannot be used with those who suffer from claustrophobia. There are also artifacts due to movement, especially the head and eyes. Finally, metal-containing objects interact with the magnetic fields of the scanners and cause distortion. fMRI tends to have excellent spatial resolution (around 1.5-4.5mm) but relatively poor temporal resolution, due to the delay between actual stimulation and detected blood flow. There is generally a trade-off between these variables, so that one can take a picture every 350-500ms but with terrible spatial resolution. More advanced data acquisition techniques can be combined with the most powerful magnets to quicken the scan-taking time, optimizing the spatial/temporal resolution trade-off. Studies currently deemed “up-to date” can be conducted with scans that capture activity after 2s using 3T fMRIs. Recently, a new technique called event-fMRI allows scans that portray changes in activation within 1-1.5s, but few labs can reliably apply this technique.
The most debatable aspect of fMRI is that even though it produces pretty pictures of brain activation, their interpretation and meaning is often controversial. The problem is, yet again, issues with the subtraction method. Specifically, these issues lie with assuming that the difference in activity between task and control is due to one mental operation (pure insertion problem). The only difference between task and control state is a factor linked to the performance. Unfortunately, “resting” states may involve increased neural activation as well, so what is the control good for? Careful experimental design with clearly defined analytical strategies can at least attenuate some aspects of pure insertion.
The main strategies used in fMRI research map onto the principles of functional segregation and integration. Designs and analysis focused on segregation aim to find focal differences between brain areas. Statistical analysis has been tailored to three principal approaches:
1) Subtractive (also called categorical) defines separate components and regional differences that identify a functional area;
2) Parametric (dimensional) regional gradient corresponds to systematic variation of mental processing and activation;
3) Factorial-Interactive often uses the additive and interactive effects of mental components A and B, A x B.
Design and analysis focused on integration aim to find correlation patterns of activity within the system. Two approaches currently dominate the field, one being functional connectivity (identifying temporal agreement of a neurophysiological index in different areas) and the other effective functionality (identifying the influence of one neural system over another).
Before we can even apply statistical methods, there are many stages of data processing through which images are constructed from the raw data collected in the scanning process. fMRI images are put together by piecing units into a picture. Each unit is called voxel (“volumetric pixel” or “volumetric picture element”), which is basically a 3D pixel. Once the voxels are combined into an image, two further stages of preprocessing are needed: realignment of the subject’s image and normalization. This means that everyone’s unique brain image must be remapped on a template that corresponds to an idealized standard brain, with spatial coordinates used to pinpoint locations in the 3D brain image.
The normalized brain templates are created by averaging hundreds of healthy control brains, such as the MNI template created by researchers at the Montreal Neurological Institute. The averaged normalized points are matched to a common stereotaxic space, through which 3D (x, y, z) coordinates can be provided depending on the particular population of subjects. For example, the widely used Talairach space has special templates for special populations, like child brain templates for ages 8-12. The three coordinate systems (in mm) are as follows:
- Sagittal: X, Left -, Right +, (0) at the interhemispheric line
- Coronal: Y, Posterior -, Anterior +, (0) at the anterior commissure
- Axial: Z, Bottom -, Top +, (0) at the plane through anterior & posterior commissures.
The most common technique to analyze this data is called statistical parametric mapping (SPM). Its purpose is to test, for brain voxels, how similarly to the task BOLD activity behaves under the null hypothesis that it does not differ from baseline. The confound is random activity unrelated to the task. Voxels that behave similarly to the task and differ from baseline are assigned “warm” colours in result displays. The more positively correlated, the warmer the colour (red/yellow/orange); on the other hand, the more negatively correlated, the cooler the colour (white/blue/black). Voxels without relation to the task are thresholded (not displayed). In practice, the chosen statistical threshold determines what is displayed and classified as activated. Establishing the correlation is only one of the aspects determining the colour and corresponding activation of the voxels in the pictures.
There is, however, yet another aspect that determines whether the extent of statistical significance (effect size) is valid or not. This is the number of fit tests run during analysis, comparisons between task and control. A classic approach was to have a priori hypothesis testing for a small number of activations in a few specific points, within a region of interest (ROI) in the Z coordinate. As time went by, researchers found that comparisons of single points relative to individual voxels were somewhat unreliable and needed a more conservative criterion. A better approach was thus introduced, according to which individual comparisons are adjusted for the volume of the ROI. In practice, this involves adjusting the significance level and accounting for a set of multiple comparisons, which decreases the p-value sufficient for rejecting the null hypothesis (ex: from 0.05 to 0.001). In further fMRI experiments, researchers deemed it appropriate to use an even more stringent criterion by adjusting p for multiple coactivation in many regions, corrected for multiple comparisons, with some of the best analyses including regions across the entire brain. This works so that the stronger the focus of the hypothesis, the less conservative the significance threshold needs to be. A strongly focused hypothesis has a limited set of precise mechanisms proposed before looking at the data, as well as relatively narrow predictions. Conversely, generic or exploratory hypotheses (so-called “fishing expeditions”) need to be backed up with more conservative and stringent thresholds.
2.4.2. Electrodynamic-based imaging techniques: EEGs and ERPs
2.4.2.1 Electroencephalogram
The electroencephalogram (EEG) reflects electrical activity recorded from the scalp and represents an image of oscillations in electrical activity across the brain. Graphically, oscillations are synchronic patterns that resemble a sequence of “waves”. This technique has superb temporal resolution (1ms) but terrible spatial resolution (up to 10 mm, but more typically counted in cm depending on scalp electrode size). EEG is generally acknowledged as a measure of macro-connectivity or neural dynamics. It reflects graded excitatory and inhibitory post-synaptic potentials (EPSP and IPSP) from pyramidal cells in the cerebral cortex. These vertical pyramidal cells are in cortical layers 3-5 and give scalp signals of up to 75mV. The main identifiable waves or frequency bands are the following:
Delta, 0-4 Hz; Theta, 4.5-7 Hz; Alpha, 7.5-12 Hz; Beta, 13-35 Hz (Beta 1: 13-20Hz; Beta 2: 20-35Hz); Gamma, >35 Hz.
(Notice Hz measures the frequency of one wave peak per second).
The probable sources for these oscillations are known projections from the thalamus to cortical layers. Where pyramidal cells are activated seems to generate alpha and beta rhythms. Theta rhythms seem to originate in the subcortical septohippocampal system. Gamma-like sleep spindles are generated from the reticular nucleus of the thalamus.
EEG amplitude as measured from the scalp is very small due to the many layers of tissue (skin, bone and fluids) electrical activity has to go through. Major amplification of the signal collected at the scalp is needed. Recording involves a monopolar electrode in an area of interest and a “reference” in an inactive area (usually the tip of the nose, an ear lobe, etc). Electrodes are placed across the scalp based on a standard montage that is usually a version of the 10-20 International System. It has three spatial coordinate parameters: anterior-posterior (nasion to inion), coronal (ear to ear) and lateral (left: odd numbers, right: even numbers). Modern techniques use “caps” with embedded electrode configurations that are ready for use and (thankfully, but still) do not require obscene amounts of time to apply every single electrode. The standard for publishable work is typically based on studies with 32 electrodes, but more and more research is conducted with 64, 128 and sometimes 256 scalp electrodes. What is recorded is the difference between active and reference electrodes. The bipolar electrode technique is used in some cases of EEG, whereby two active electrodes are placed over cortical areas of interest. Bipolar leads record the difference of electrical potentials between the regions. Symmetry or asymmetry of activity in bipolar areas can be quite helpful because if there are no contaminations or confounds, they can indicate whether regions talk back to each other (symmetric: functionally connected) or not (asymmetric). This can indicate impairment or lesion. Electrode paste (a conducting agent) is applied to facilitate contact of electrodes with the skin and the passage of electrical activity. An important variable in recording and setting up EEGs is impedance, the resistance to passage of electrical activity. It is measured in Ohms; if impedance is <5 KOhms, there’s usually good electrode contact.
An alpha rhythm (or synchronization) with relatively high amplitude is considered a marker of resting states. Changes in the resting EEG due to stimulus activation are correlated with a change in alpha oscillation or synchronic pattern in units of time (per 1 second). Such change can manifest as a decrease in the amplitude of alpha activity or a shift to beta, also known as alpha blocking or desynchronization. This an important way of interpreting the EEG since changes from alpha and beta to delta, theta or gamma are correlated with different states of consciousness.
There are many ways to study desynchronization. One is to measure the EEG period, the total number of waves recorded in the interval of time between stimulus and response. This method allows us to relate EEG to speed of response in a task. Another measure of desynchronization has been derived using EEG coherence, or correlation of activity in two regions as compared to other ones. This method shows that two regions are functionally and/or structurally connected. Finally, another method is the use of Event-related desynchronization, a specific form of alpha activity change to theta and lower frequencies or beta. It is circumscribed, phasic and specifically localized related to a specific task, interrupting relatively long periods of alpha activity.
As previously mentioned, EEG signals reflect synchronized discharges from thalamic nuclei to the cortex. The extent of synchronization is reflected in EEG amplitude. Most of the EEG signal reflects activity in the cortical regions near the recording electrode. Cortical column organization allows these signals to summate. Thus, EEG recorded at the scalp corresponds to summation of electrical activity across large neuronal aggregates that could include millions of neurons. Regional desynchronization is interpreted as increased mutual interaction of subsets of neural aggregates, generally marked by decreases in amplitude. By opposition, increases in amplitude may reflect hypersynchronization, implying reduced integration and more segregated activity within neural pools.
2.4.2.2 ERPs
Evoked or Event-related potentials (ERPs) are averaged segments of EEG time-locked to a specific stimulus or event. In this technique, stimulus response is recorded repeatedly with background, random EEG activity averaged out. Consequently, peaks and waveforms are related to the event. Changes in the wave involve amplitude, latency, duration and distribution over the scalp (topography). There is usually an underlying model of component processes that guides their interpretation, since the event defines what the ERP corresponds to.
ERPs are very small, much smaller than background EEGs. Background EEG, if random, fluctuates over the zero baseline. The averages of many repeated responses to a repeatedly presented stimulus will produce an averaged summation over a random zero baseline. The average starts pre-stimulus to include a zero baseline of random EEG/ERP. In addition to this, to obtain ERP solely due to the task, calibration for eye movement (electrooculograms, EOGs) and other artifacts (eye blinks) is needed. The ERP signal increases with sample size while random EEG activity in the background stays the same, only changing due to random noise.
Much empirical research has shown the meaning of the peaks and their timing. They are designated based on milliseconds after stimulus presentation and direction of polarity, “P” being positive and “N” being negative. ERPs are classified according to neurocognitive and cortical processes. The most accepted types and their localization are listed below:
- Sensory ERPs: Cortical visual, auditory, somatosensory and olfactory (primary sensory cortical areas and/or thalamic connections to the cortex)
- Motor potentials: Contralateral precentral (frontocentral, FCs, electrodes) cortex
- Attention potentials: Before 200ms (P1, N1, N2) in primary, parietal and frontal areas
- Long-latency “cognitive” potentials: P3, N4, P6, P8, fontal and parietal
- Brainstem auditory evoked response: Between 0 and 10-60ms, from brainstem nuclei
Measuring changes in the amplitude and timing of ERP peaks (latency and duration), as well as in topographical spatial distribution, time-locked to tasks and stimuli, can be invaluable to make inferences about differences in underlying states of consciousness.
2.4.3. Brain Stimulation Techniques
Transcranial magnetic stimulation (TMS) and transcranial direct current stimulation (tDCS) are two emerging neuroimaging techniques for non-invasive stimulation of the superficial cortex. Depending on stimulation parameters (intensity and rate of stimulation), TMS and tDCS can excite or inhibit sites in the cortex. This allows creation and mapping of transient functional lesions.
Anodal stimulation is characterized by neural excitation; depolarization is induced by reducing regional levels of inhibitory gamma-aminobutyric acid (GABA). Cathodal stimulation is characterized by neural inhibition; hyperpolarization is induced by decreasing excitatory glutamate (Glu) transmission. Both techniques involve the use of wire coils placed above the scalp, producing magnetic pulses in TMS and very weak electrical currents in tDCS. For TMS, a virtual lesion can be induced from a single high energy pulse. Stimulation with low frequencies (0.2-1Hz) is inhibitory, whereas high frequencies (1-50Hz) are excitatory. For tDCS, 0.5-2mA direct current is needed to achieve the same results. These techniques do not activate corticospinal neurons directly but through synaptic input mediated by cortical interneurons.
When combined with other brain imaging from PET, fMRI and EEG, which provide the specific underlying neuroanatomy, brain stimulation techniques can be used to study cortical excitability and connectivity. Specifically, they can be used to manipulate and then investigate the precise relationship between focal (narrow) cortical activity and behaviour, the “when” or timing of action/contribution of a particular cortical region, and the mapping of functional connectivity between cortical regions (spatial and temporal extent of the stimulation’s effect).