29 Graphs
Plane curve: is the graph of an equation in two variables; that is the set of all points  that satisfy the equation.
In particular, the graph of a function  is the set

 -Intercepts = -coordinates of a point where the graph crosses the -axis.
 -Intercepts = -coordinates of a point where the graph crosses the -axis.
Symmetry : a graph  is
is
 symmetric with respect to the -axis if :
symmetric with respect to the -axis if : 
symmetric with respect to the origin if : 
symmetric with respect to the line  if :
if : 
Exercise 1
Show/Hide Solution.
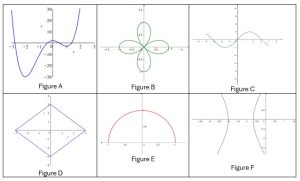
Figure A is the graph of a function because the vertical line rule is satisfied.
Figure B is not the graph of a function because the vertical line rule is not satisfied.
Figure C is the graph of a function because the vertical line rule is satisfied.
Figure D cannot be the graph of a function because the vertical line  intersects the curve into two different points
  and
and  .
.
Figure E is the graph of a function because the vertical line rule is satisfied.
Figure F is not the graph of a function because the vertical line rule is not satisfied.
Exercise 2
Show/Hide Solution.
Set  , then
  . Hence
  are the -intercepts.
Set  , then
  . Hence
  are the -intercepts.
Exercise 3
Show/Hide Solution.
Set , then  . Hence
  are the -intercepts.
Set , then  . Hence is the -intercept.
Exercise 4
Show/Hide Solution.
* Substitute  for :
for :  .
.
Since the equation is unchanged, the graph has -axis symmetry.
* Substitute  for :
for :  .
.
Since the equation is unchanged, the graph has -axis symmetry.
* Substitute for and for :  .
.
Since the equation is unchanged, the graph has origin symmetry.
Exercise 5
Show/Hide Solution.
* Substitute for :  .
.
Since the equation is changed, the graph does not have -axis symmetry.
* Substitute for :  .
.
Since the equation is changed, the graph does not have -axis symmetry.
* Substitute for and for :  .
.
Since the equation is changed, the graph does not have origin symmetry.
